
This is a worksheet I have had for a while for calculating estimates using not a single value, but three values for best case, most likely case, and worse case. The values are combined using the PERT formula, to calculate a total estimate, statistical ranges, and an overall estimate including contingency.
Download the worksheet here:

Individual estimate calculations
The standard PERT formula is used to calculate the Expected estimate for each individual item:
Expected = ( Best + 4 × Likely + Worst ) / 6
However, to calculate the standard deviation, the PERT formula assumes the Best-Worst range covers 99.7%, 6 standard deviations, of cases. In practice this is unlikely to be the case.
The default options in the worksheet use some guidance from Steve McConnell's "Software Estimation: Demystifying the Black Art" (although PERT estimation is applicable to any project, not just software) and assumes the Best-Worst range is a 70% confidence interval and uses a factor of 2.1 standard deviations.
Standard Deviation = ( Worst - Best ) / 2.1
The worksheet also calculates the skew for individual items, using the Pearson approximation, where Likely is the mode and Expected is the mean.
Skew = ( Expected - Likely ) / Standard Deviation
Total estimate calculations
The total expected estimate is the sum of the individual items.
You cannot directly sum up the Best or Worst estimates, but you can sum up the variances (square of the standard deviation) and take the square root to get a standard deviation for the total.
From that you can calculate a total Best-Worst range, with the same confidence interval used for the individual items.
To factor in skew, the worksheet takes the average weighted skew (weighted by the expected value), and then adjusts Best, Worst, and Likely by the skew amount. A positive skew shifts both Best and Worst to the right, while shifting Likely to the left.
Final estimate
The final estimate uses the calculated total expected value and standard deviation to add a contingency based on a desired confidence interval of 99.7%, the original objective of the PERT process.
It takes in practice estimates of a 70% confidence range for individual items to generate a 99.7% confidence interval for a total estimate.
Both the statistical accuracy and final estimate confidence intervals can be changed if needed, e.g. if your accuracy is higher than 70%.
Evaluation vs actuals
The worksheet also includes a tab where you can input the actual time taken for each individual item, which will be compared to the estimates to provide feedback.
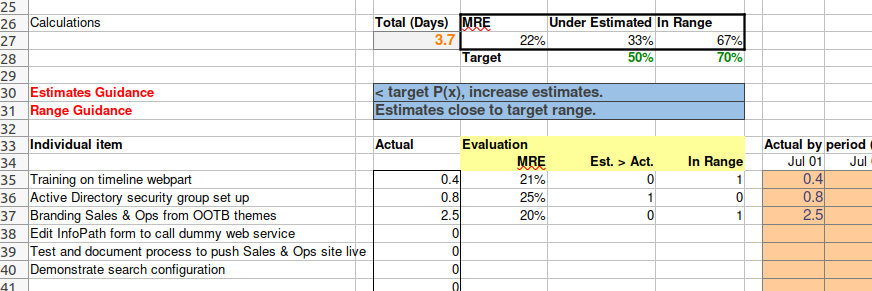
The evaluation calculates the Mean Relative Error (MRE), which gives an indication of how accurate the estimates are overall.
For more detailed feedback, it also calculates whether individual items were over or under estimated, and whether they were within the Best-Worst range or not.
These can be compared to provide guidance.
For the estimates, it can tell you whether you are too low or too high (or on track), and need to either increase or decrease your estimates.
For the range, it can tell you whether you are meeting the expected confidence interval or not, and so whether to increase the size of your ranges or decrease them. Alternatively, you could also adjust the statistical accuracy for future project estimates to match your past results.
Usage
You are free to use or adapt the worksheets, which are released under the Creative Commons Attribution 4.0 International License, and any feedback on their usage is welcome.