OpenTelemetry has quickly established itself as the standard observability framework, and is now supported by every major observability platform and programming language, including Microsoft .NET.
The .NET libraries provide instrumentation across a wide range of components, and connection options to many observability platforms, either via the standard OpenTelemetry Protocol (OTLP), custom connectors, or the OpenTelemetry Collector.
Using observability platforms, whilst powerful, require infrastructure setup that can slow down getting started.
This article introduces the Essential OpenTelemetry Colored Console exporter, allowing you to use OpenTelemetry in your .NET projects from day one, supporting development without needing any additional infrastructure, while setting you up for future access to the entire rich OpenTelemetry ecosystem.
In this post we will cover how to the the built in support for OpenTelemetry in modern .NET to instrument your distributed application for tracing and logging, how the OpenTelemetry Collector can be used to simplify instrumention, and how the OpenTelemetry Protocol is building a (brilliant) connected future.
We will now go further than logging and look at tracing. Tracing looks at the different units of work (spans) done during an operation (trace), how they are connected, and the timings of the different components. This is an important tool for investigating performance issues in distributed systems.
An example distributed trace timeline, across multiple components, viewed in Jaeger, one of many supported tools:
As well as looking at individual traces timings can be aggregated across the system to find the slowest areas, and identify anomalies.
For any modern dotnet system, distributed tracing is already built in to the default web client, server, and other operations.
You can see this with a basic example, by configuring your logging to display the correlation identifier. Many logging systems, such as Elasticsearch, display correlation by default. The identifiers can also be passed across messaging, such as Azure Message Bus.
Logging has always been a useful way to understand what is happening within a system and for troubleshooting. However, modern systems are very complex, with multiple layers and tiers, including third party systems.
Trying to understand what has happened when a back end service log reports an error, and then correlating that to various messages and front end actions that triggered it requires some kind of correlation identifier.
This problem has existed ever since we have had commercial websites, for over 20 years of my career, with various custom solutions.
Finally, in 2020, a standard was created for the format of the correlation identifier, and how to pass the values: W3C Trace Context. In a very short amount of time all major technology providers have implemented solutions.
The examples below show how this is already implemented in modern dotnet.
Application Insights is the application performance monitoring feature of Azure Monitor, and can be used to monitor deployed applications both in the cloud and on premises. App Insights supports W3C Trace Context standard headers to correlate tracing information across different components.
The features of App Insights, and Azure Monitor, are quite broad, whereas developers may want in some cases to filter down and focus on application-specific logging. Trace correlation is an important part of this, to get and end-to-end overview of operations.
To view logs, connect your App Insights instance to a Log Analytics workspace. Within the workspace, General > Logs will provide access to the query editor — you can either user one of the default Queries pop-up or write your own.
For example, to see all recent traces, and the correlation between them you can use a query like:
union AppTraces, AppDependencies, AppRequests
| where TimeGenerated > ago(30m)
   and Properties.CategoryName !startswith "Microsoft"
| sort by TimeGenerated desc
| project TimeGenerated, Type, OperationId, Id, Properties.SpanId,
   ParentId, ClientType, Message, Name, SeverityLevel, Properties,
   Properties.CategoryName, OperationName, SessionId,
   UserId, AppRoleInstance
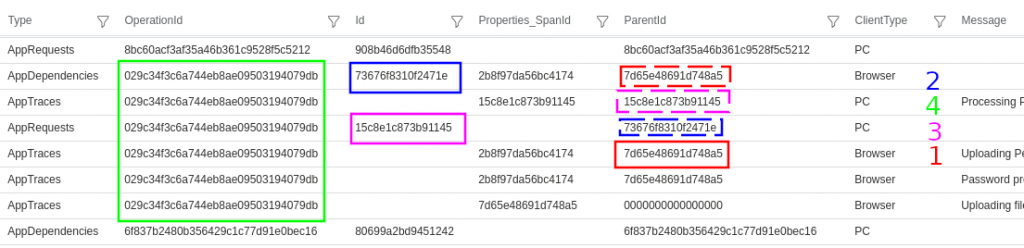
Example output:
This example shows all the traces from one operation are linked to the same OperationId 029c3..., and the parent-child relationship between two tiers client (Browser) and server (PC) can also be determined:
Client (Browser) AppTraces have a ParentId 7d65e...
The client has a link from this parent to a child AppDependency with Id 73676...
On the server (PC) the dependency is recorded as the parent if the AppRequest Id 15c7e...
Additional traces on the server show the request as the ParentId (and there may be further parent-child links depending on the number of tiers).
There are many other types of records that can be queried, for example developers may often be interested in exceptions and traces that feature a particular keyword:
union AppExceptions, AppTraces
| where TimeGenerated > ago(30m)
| sort by TimeGenerated desc
| search "Password"
Earlier this year the W3C Trace Context Recommendation was finally published. A standard way of passing distributed trace correlation has been needed for a long time, and it is good to see there is finally a standard, and many vendors have already moved to adopt it.
The Recommendation defines what a distributed trace is:
A distributed trace is a set of events, triggered as a result of a single logical operation, consolidated across various components of an application. A distributed trace contains events that cross process, network and security boundaries. A distributed trace may be initiated when someone presses a button to start an action on a website - in this example, the trace will represent calls made between the downstream services that handled the chain of requests initiated by this button being pressed.
What constitutes a single logical operation depends on the system. In the example above it is a single button press on a website, whereas in a batch processing system it might be for each item processed, or in a complex UI it might consist of both a button press and a subsequent confirmation dialog.
The W3C Trace Context Recommendation describes how the correlation information — an identifier for the operation, and the parent-child relationships between components — is passed in service calls, but doesn't cover what to do with that information, apart from how to pass it to the next component.
This is a guide mostly how to use Trace Context for logging, although it also applies to metrics and other telemetry.
Then add the logger provider to your host builder, and the default configuration will write to a local Elasticsearch service:
using Essential.LoggerProvider;

// ...

    .ConfigureLogging((hostContext, loggingBuilder) =>
    {
        loggingBuilder.AddElasticsearch();
    })
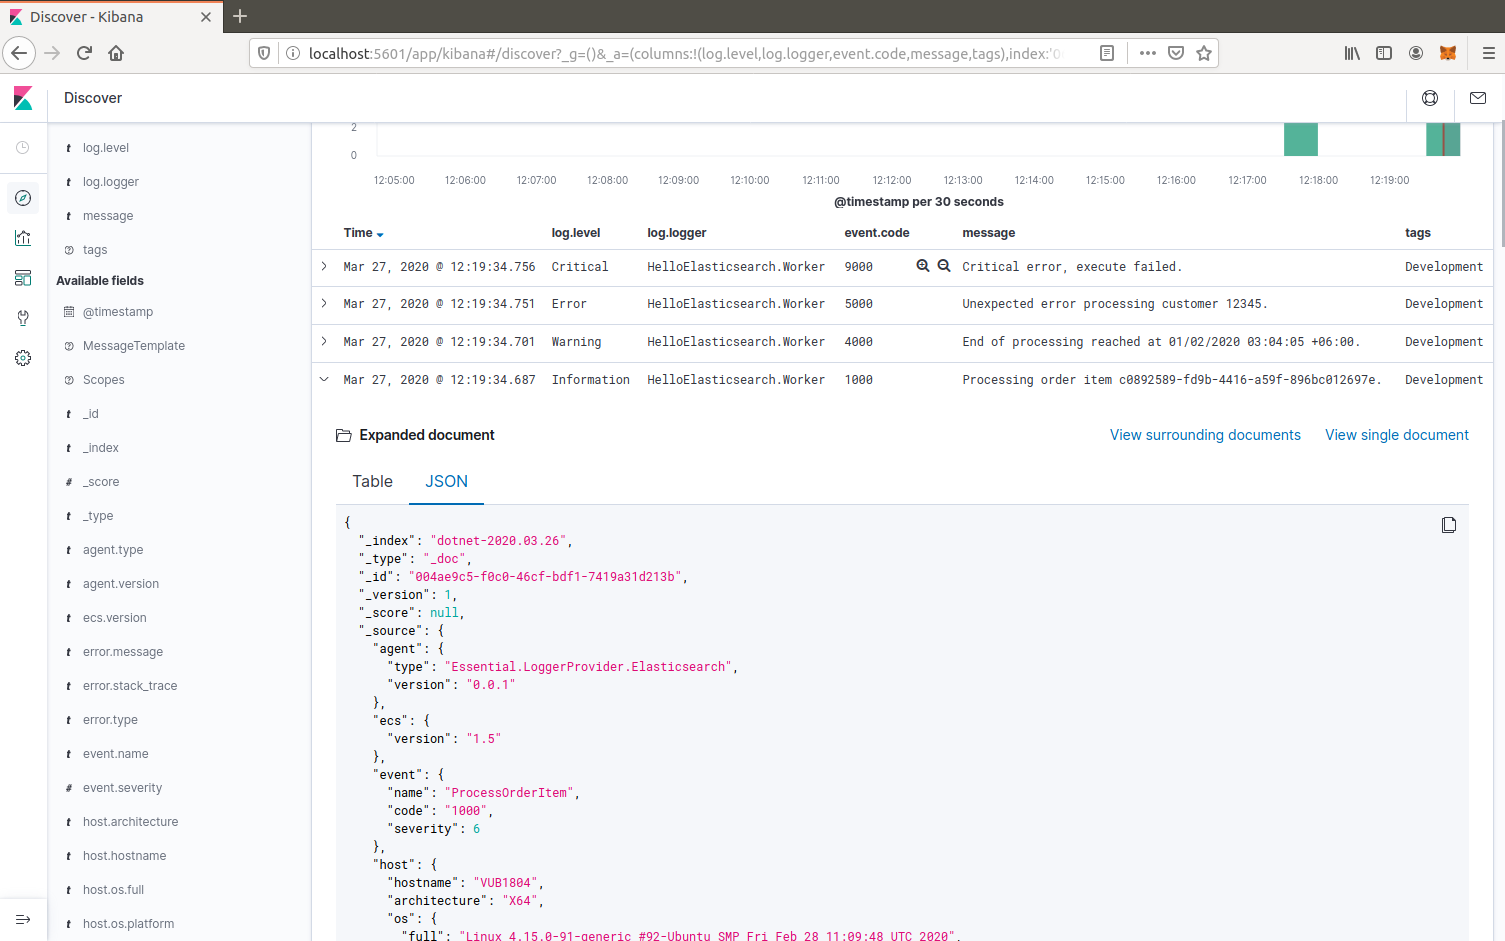
Once you have logged some events, open up Kibana (e.g. http://localhost:5601/) and define an index pattern for dotnet-* with the time filter @timestamp.
You can then discover the log events for the index. Some useful columns to add are log.level, log.logger, event.code, message, tags, and process.thread.id.
Structured message and scope values are logged as labels.* custom key/value pairs, e.g. labels.CustomerId.
I have always found it useful for applications to display their build version, and for libraries to have the build version in their properties. Relying on properties like the date (or file size) is always a bit risky.
.NET Core has embraced Semantic Versioning and at first glance appears to have a new way to specify version numbers.
It doesn't quite work to my full satisfaction, but luckily the older methods still work, so a basic GitVersion task in your build pipeline is pretty much all you need to get things working.
Following hot on the heels of v2 of Essential.Diagnostics, work on the beta version of the Essential.Diagnostics.SeqTraceListener has been completed, and it has been published to NuGet.
This provides a trace listener implementation that forwards messages to a Seq logging server. For performance it forwards messages in batches (with the first message being sent immediately, so you know the system is up and running), with automatic back off and retry when there are interruptions to the network communication.
This component can be used with the new Microsoft.Extensions.Logging for .NET 4.5.1 and above, or with Sytem.Diagnostics.TraceSource for .NET 2.0 through 4.5.
I have made significant changes in the organisation of the Essential.Diagnostics project; although none of the actual implementations have changed, the project has been split into separate packages for each trace listener, available via NuGet.
An Office 365 Developer subscription (essential for anyone doing SharePoint development)
A central Git repository (e.g. Visual Studio Online), for source control
TeamCity build (e.g. hosted in Azure), for builds
Octopus Deploy, for deployment
This stack allows automated deployment of the project against a continuous integration (CI) environment. Simple migration scripts (written in PowerShell) are cumulatively run against the environment, and can be easily promoted to a UAT and then Production environment.