
Application Insights is the application performance monitoring feature of Azure Monitor, and can be used to monitor deployed applications both in the cloud and on premises. App Insights supports W3C Trace Context standard headers to correlate tracing information across different components.
The features of App Insights, and Azure Monitor, are quite broad, whereas developers may want in some cases to filter down and focus on application-specific logging. Trace correlation is an important part of this, to get and end-to-end overview of operations.
To view logs, connect your App Insights instance to a Log Analytics workspace. Within the workspace, General > Logs will provide access to the query editor — you can either user one of the default Queries pop-up or write your own.
For example, to see all recent traces, and the correlation between them you can use a query like:
union AppTraces, AppDependencies, AppRequests
| where TimeGenerated > ago(30m)
   and Properties.CategoryName !startswith "Microsoft"
| sort by TimeGenerated desc
| project TimeGenerated, Type, OperationId, Id, Properties.SpanId,
   ParentId, ClientType, Message, Name, SeverityLevel, Properties,
   Properties.CategoryName, OperationName, SessionId,
   UserId, AppRoleInstance
Example output:
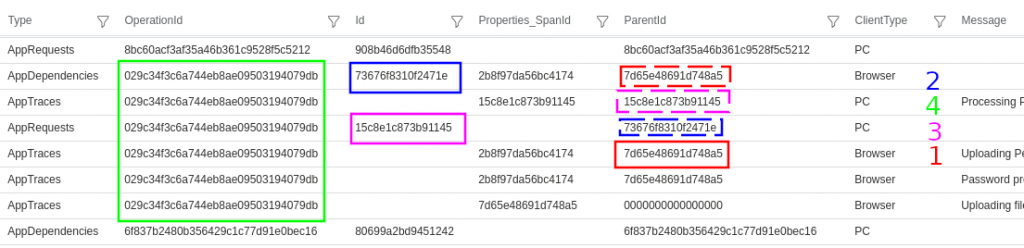
This example shows all the traces from one operation are linked to the same OperationId 029c3..., and the parent-child relationship between two tiers client (Browser) and server (PC) can also be determined:
- Client (Browser) AppTraces have a ParentId
7d65e... - The client has a link from this parent to a child AppDependency with Id
73676... - On the server (PC) the dependency is recorded as the parent if the AppRequest Id
15c7e... - Additional traces on the server show the request as the ParentId (and there may be further parent-child links depending on the number of tiers).
There are many other types of records that can be queried, for example developers may often be interested in exceptions and traces that feature a particular keyword:
union AppExceptions, AppTraces
| where TimeGenerated > ago(30m)
| sort by TimeGenerated desc
| search "Password"
W3C Trace Context
I have previously written a guide to W3C Trace Context; in fact this post about App Insights was originally part of the earlier article, but it was important enough that I separated it out (and added a few bits).
App Insights is in the process (as at November 2020) of changing over from variable length identifiers it previously used to a W3C Trace Context header based approach.
App Insights treats log messages as children of a span, and so records the current span in the parent field, which is different from how Microsoft.Extensions.Logging passes the parameters.

The first (bottom) message is the start of the AppRequest, which shows how App Insights records the ParentId (a693...) and the Id of the server span (a3b1...). AppTrace messages are treated as children, with the span recorded as the ParentId (a3b1...)
When there is a server-side transfer (creating a child AppInsights operation) we see similar with the parent-child relationship recorded in an AppDependency, and with the AppTrace only showing the current span (as ParentId).
Shown beside are the Microsoft.Extensions.Logging properties, where the current span is recorded in Properties.SpanId, and the parent span is repeated in each trace as Properties.ParentId. Using these properties the parent-child relationship is recorded directly in the traces.
The logging Scope used to record the properties is stack based, so the context reverts correctly for the properties in the last logging message, but not for the AppInsights context.
To use W3C Trace Context, make sure to set the default format in Program.cs, so that newly created traces used the W3C format.
Activity.DefaultIdFormat = ActivityIdFormat.W3C;
.NET 5.0 has added significantly to the implementation of W3C Trace Context, both in System.Diagnostics.DiagnosticsSource and Microsoft.Extensions.Logging.
Application Insights for web pages
There is also a web client for App Insights that (as at Nov 2020) has also started moving across to W3C Trace Context.
The default is still the hierarchical format:
So make sure to configure ApplicationInsights with the W3C format:
distributedTracingMode: DistributedTracingModes.W3C,
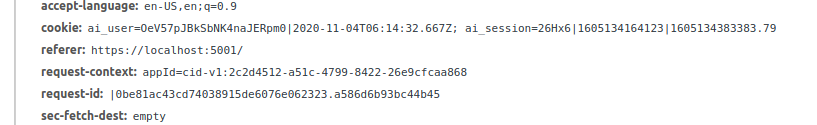
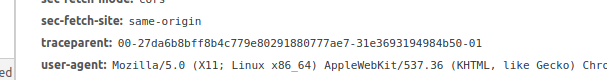
Once enabled, context is passed via the traceparent header:
The resulting logs can be seen in the Azure Log Analytics workspace. Note that you need to query AppDependencies and AppRequests, as well as AppTraces, to determine some of the parent-child relationships.

In this case, all the logs have the same OperationId, even though they were different button presses (see the different times on the left). App Insights treats traces as children of the span, but there is no current span, so it puts the full trace-id (OperationId) into the ParentId field.
Start new span
I have forked the App Insight React Sample to illustrate how we can start a new span, and a new trace, for each button press operation, and add properties in the same format used by Microsoft.Extensions.Logging.
The App Insights web SDK has a trace context that we can use. Note that because App Insights treats traces as children of the span, the current span is recorded in the parentID field of the context. We use previousParentID to then store the actual parent.
function startSpan(spanName, parentTelemetryTraceContext) {
  const traceId = parentTelemetryTraceContext?.traceID ?? Util.generateW3CId();
  const newSpanId = Util.generateW3CId().substring(0, 16);
  const parentSpanId = parentTelemetryTraceContext?.parentID ?? '0000000000000000';

  const telemetryTraceContext = new TelemetryTrace(traceId, newSpanId, spanName);
  telemetryTraceContext.previousParentID = parentSpanId;

  appInsights.context.telemetryTrace = telemetryTraceContext;
}
Include trace context span details
We can also include the trace context from the client in a similar format to that used by Microsoft.Extensions.Logging by using a trace initializer. Note that we use the context parentID as the SpanId property, and the previousParentID (that we added) as the ParentId.
// Note: See below for an updated version that also handles AppDependency
var telemetryTraceContextInitializer = (envelope) => {
  const telemetryTraceContext = appInsights.context?.telemetryTrace;
  if (telemetryTraceContext !== undefined) {
    envelope.baseData = envelope.baseData ?? {};
    envelope.baseData.properties = envelope.baseData.properties ?? {};
    envelope.baseData.properties.TraceId = telemetryTraceContext.traceID ?? '';
    envelope.baseData.properties.SpanId = telemetryTraceContext.parentID ?? '';
    envelope.baseData.properties.ParentId = telemetryTraceContext.previousParentID ?? '';
  }
}
appInsights.addTelemetryInitializer(telemetryTraceContextInitializer);
By adding the trace context, including the span, in the same format as the server logging, we can see all the values.

We can see (1) the AppTraces from the Browser, with the span (5cc4...) recorded in ParentId by AppInsights and Properties.SpanId by our initializer, along with a Properties.ParentId of '0000...', indicating it is a root span.
When the AppInsights web SDK sends a request to the server, instead of using the current span (5cc4...), it creates a new random ID (a693...), records an AppDependency, and then sends the new ID in the traceparent header. This record arrives after the server request is complete.
On the server, AppInsights records an AppRequest (3) that has the link between the incoming parent (a693...) and the new span (a3b1...).
Server side traces (4) are then recorded within that server span (a3b1...) — in the ParentId by AppInsights and Properties.SpanId by Microsoft.Extensions.Logging. The properties also include Properties.ParentId to directly record the parent-child relationship.
Records (5) and (6) show a server-side transfer, again with AppInsights using a separate AppDependencies record and Microsoft.Extension.Logging recording the parent directly.
Records (X) and (Y) show a separate button press operation, getting a new trace-id (OperationId), and showing client-side creation of a new child span, being recorded in the properties added by our initializer.
Aligning the client-side AppDependency
The client-side AppDependency is needed, as it is the only place the relationship between the client span (5cc4...) and the parent (a693...) passed in the request exists.
Adding some code to our initializer to handle this will allow this link to also be recorded in the Property.SpanId and Property.ParentId fields:
var telemetryTraceContextInitializer = (envelope) => {
  const telemetryTraceContext = appInsights.context?.telemetryTrace;
  if (telemetryTraceContext !== undefined) {
    if (envelope.name === 'Microsoft.ApplicationInsights.{0}.RemoteDependency') {
      envelope.baseData = envelope.baseData ?? {};
      envelope.baseData.properties = envelope.baseData.properties ?? {};
      envelope.baseData.properties.TraceId = telemetryTraceContext.traceID ?? '';
      envelope.baseData.properties.SpanId = envelope.baseData.id?.slice(-17, -1) ?? '';
      envelope.baseData.properties.ParentId = telemetryTraceContext.parentID ?? '';
    } else {
      envelope.baseData = envelope.baseData ?? {};
      envelope.baseData.properties = envelope.baseData.properties ?? {};
      envelope.baseData.properties.TraceId = telemetryTraceContext.traceID ?? '';
      envelope.baseData.properties.SpanId = telemetryTraceContext.parentID ?? '';
      envelope.baseData.properties.ParentId = telemetryTraceContext.previousParentID ?? '';
    }
  }
}
appInsights.addTelemetryInitializer(telemetryTraceContextInitializer);
This records the current span (parentID in the context) as the parent, and pulls out the newly generated value, that will be passed in traceparent, from the baseData.id field.
Mentions