
Application Insights is the application performance monitoring feature of Azure Monitor, and can be used to monitor deployed applications both in the cloud and on premises. App Insights supports W3C Trace Context standard headers to correlate tracing information across different components.
The features of App Insights, and Azure Monitor, are quite broad, whereas developers may want in some cases to filter down and focus on application-specific logging. Trace correlation is an important part of this, to get and end-to-end overview of operations.
To view logs, connect your App Insights instance to a Log Analytics workspace. Within the workspace, General > Logs will provide access to the query editor — you can either user one of the default Queries pop-up or write your own.
For example, to see all recent traces, and the correlation between them you can use a query like:
union AppTraces, AppDependencies, AppRequests
| where TimeGenerated > ago(30m)
   and Properties.CategoryName !startswith "Microsoft"
| sort by TimeGenerated desc
| project TimeGenerated, Type, OperationId, Id, Properties.SpanId,
   ParentId, ClientType, Message, Name, SeverityLevel, Properties,
   Properties.CategoryName, OperationName, SessionId,
   UserId, AppRoleInstance
Example output:
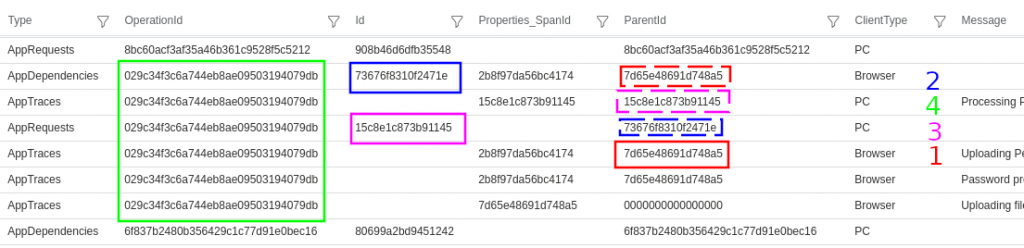
This example shows all the traces from one operation are linked to the same OperationId 029c3..., and the parent-child relationship between two tiers client (Browser) and server (PC) can also be determined:
- Client (Browser) AppTraces have a ParentId
7d65e... - The client has a link from this parent to a child AppDependency with Id
73676... - On the server (PC) the dependency is recorded as the parent if the AppRequest Id
15c7e... - Additional traces on the server show the request as the ParentId (and there may be further parent-child links depending on the number of tiers).
There are many other types of records that can be queried, for example developers may often be interested in exceptions and traces that feature a particular keyword:
union AppExceptions, AppTraces
| where TimeGenerated > ago(30m)
| sort by TimeGenerated desc
| search "Password"