
OpenTelemetry has quickly established itself as the standard observability framework, and is now supported by every major observability platform and programming language, including Microsoft .NET.
The .NET libraries provide instrumentation across a wide range of components, and connection options to many observability platforms, either via the standard OpenTelemetry Protocol (OTLP), custom connectors, or the OpenTelemetry Collector.
Using observability platforms, whilst powerful, require infrastructure setup that can slow down getting started.
This article introduces the Essential OpenTelemetry Colored Console exporter, allowing you to use OpenTelemetry in your .NET projects from day one, supporting development without needing any additional infrastructure, while setting you up for future access to the entire rich OpenTelemetry ecosystem.
Adding the OpenTelemetry Colored Console
OpenTelemetry is the industry-standard observability framework for traces, metrics, and logs. You can get started with OpenTelemetry, for a standard .NET 10 host application, with just three simple steps:
- Add the necessary nuget package references:
dotnet add package OpenTelemetry.Extensions.Hosting
dotnet add package Essential.OpenTelemetry.Exporter.ColoredConsole- Add the necessary using statements:
using Essential.OpenTelemetry;
using Microsoft.Extensions.DependencyInjection;
using Microsoft.Extensions.Logging;- Clear the default loggers, and configure OpenTelemetry with the colored console exporter, assuming a standard
WebApplicationBuilderorHostApplicationBuilder:
builder.Logging.ClearProviders();
builder.Services.AddOpenTelemetry()
.WithLogging(logging =>
{
logging.AddColoredConsoleExporter();
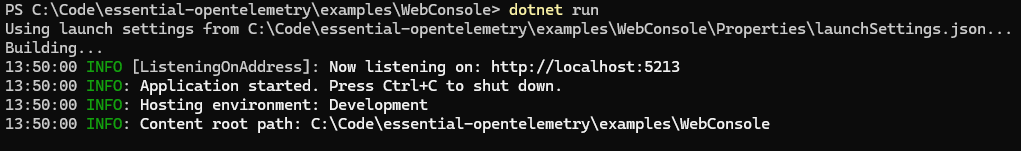
});That's it. If you were previously using the default logger, there is nothing more to do, and your logs will appear similar to the screenshot above.
You are now using OpenTelemetry, with console logs showing OpenTelemetry features such as log event names and trace correlation IDs.
You can continue development as normal, knowing that in the future you will have access to the OpenTelemetry ecosystem when needed.
What is OpenTelemetry ?

OpenTelemetry is the industry movement that arose from the W3C Trace Identifier standardisation, and the combination of two open source projects OpenCensus and OpenTracing.
It provides an open source, vendor neutral framework for observability, supporting traces, metrics, and logs, and with instrumentation for many systems provided out of the box.
OpenTelemetry has a strong ecosystem of vendors and languages, and many platforms have made it the default for interoperability.

Instrumentation libraries
Pre-built instrumentation libraries are available for various components, e.g. for an ASP.NET application you can use the OpenTelemetry.Instrumentation.AspNetCore package for traces and metrics.
Following on from the basic setup, above:
dotnet add package OpenTelemetry.Instrumentation.AspNetCoreThen add the additional usings and OpenTelemetry configuration:
using OpenTelemetry.Metrics;
using OpenTelemetry.Trace;

    ...
    .WithTracing(tracing =>
    {
        tracing.AddAspNetCoreInstrumentation().AddColoredConsoleExporter();
    })
    .WithMetrics(metrics =>
    {
        metrics
            .AddAspNetCoreInstrumentation()
            .AddView(instrument =>
                instrument.Name.StartsWith("http.server.request", StringComparison.Ordinal)
                    ? null
                    : MetricStreamConfiguration.Drop
            )
            .AddColoredConsoleExporter(options => { }, exportIntervalMilliseconds: 60_000);
    });
Note that the AddView() filtering is an advanced configuration and only shown to limit the metrics for readability of the example.
Example output:
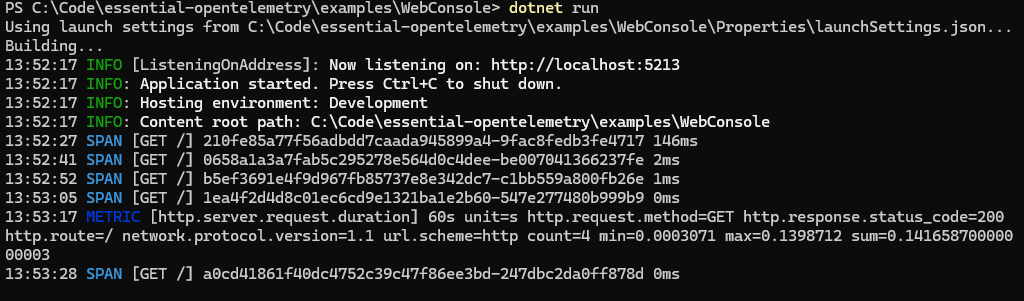
The ASP.NET trace instrumentation will output a span for each web request path, along with the duration, e.g. 13:25:07 SPAN [GET /] bd77d8bc415055f0d85fd1fdd5dde838-0cfd88b3f04281b6 84ms.
Trace instrumentation is also available for HTTP client, SQL Server, Entity Framework, and many other components.
ASP.NET instrumentation metrics have been filtered with to show just HTTP requests for the purpose of this example. Metrics show, over a specified time period, the count of requests by route and status code, with the sum of response time, for statistical calculations, e.g. 13:26:01 METRIC [http.server.request.duration] 60s unit=s http.request.method=GET http.response.status_code=200 http.route=/ network.protocol.version=1.1 url.scheme=http count=2 min=0.0008918 max=0.0793882 sum=0.08028
Note that while metrics are supported in the console, they may be more useful if you sent them to an observability platform that can aggregate them and generate reports.
Example application
If you just want an example getting started application, then open a terminal or command prompt and create a new console application:
dotnet new console -n HelloOpenTelemetry
cd HelloOpenTelemetry
Install the necessary NuGet packages:
dotnet add package Microsoft.Extensions.Hosting
dotnet add package OpenTelemetry.Extensions.Hosting
dotnet add package Essential.OpenTelemetry.Exporter.ColoredConsole
And replace the contents of Program.cs with the following code:
using Essential.OpenTelemetry;
using Microsoft.Extensions.DependencyInjection;
using Microsoft.Extensions.Hosting;
using Microsoft.Extensions.Logging;

// Create the application host with OpenTelemetry
var builder = Host.CreateApplicationBuilder(args);

// Clear default logging providers and configure OpenTelemetry
builder.Logging.ClearProviders();
builder
    .Services.AddOpenTelemetry()
    .WithLogging(logging =>
    {
        logging.AddColoredConsoleExporter();
    });

var host = builder.Build();

// Get the logger from the service provider
var logger = host.Services.GetRequiredService<ILogger<Program>>();

// Log some messages
logger.LogInformation("Hello World!");
logger.LogWarning("This is a warning message");
logger.LogError("This is an error message");
More tutorials and examples are provided in the Getting Started section of the project on github.
What about the standard OpenTelemetry console exporter?
While the OpenTelemetry .NET libraries do include a console exporter, it is aimed towards learning and examining the internal workings of OpenTelemetry, and is not suitable for everyday development.
The output is very verbose, providing many lines of details for each single operation, covering the full set of fields that are used.
For example, a simple program with one log message, one span, and one metric produces just 3 lines with the colored console exporter, but over 35 lines with the standard console exporter — enough to fill an entire terminal screen.
If you want to learn more about the intricacies of OpenTelemetry, you can easily enable it, but for regular development you are better off using the colored console exporter.
Next steps
Once you have the basic console exporter in place, you can continue development, secure that you have access to OpenTelemetry as needed in the future, whether that is setting up a local observability platform or deploying to a cloud observability provider.
See my earlier article of examples using observability platforms from OpenTelemetry .NET for:
- How to set up a resource builder for OpenTelemetry metadata
- Using local observability platforms such as Loki and Jaeger
- Using a cloud observability platform such as Azure Monitor
- Using the OpenTelemetry Collector agent
How about a file exporter?
Yes, I am working on a file exporter, following the experimental OpenTelemetry Protocol File specifications, https://opentelemetry.io/docs/specs/otel/protocol/file-exporter/
If there is something different you want, feel free to raise an issue describing what you want. I have previously done rotating file exporters, including one for Microsoft.Extensions.Logging that is still usable https://github.com/sgryphon/essential-logging/tree/main/src/Essential.LoggerProvider.RollingFile