Modern distributed tracing with dotnet(5 min read)

For any modern dotnet system, distributed tracing is already built in to the default web client, server, and other operations.

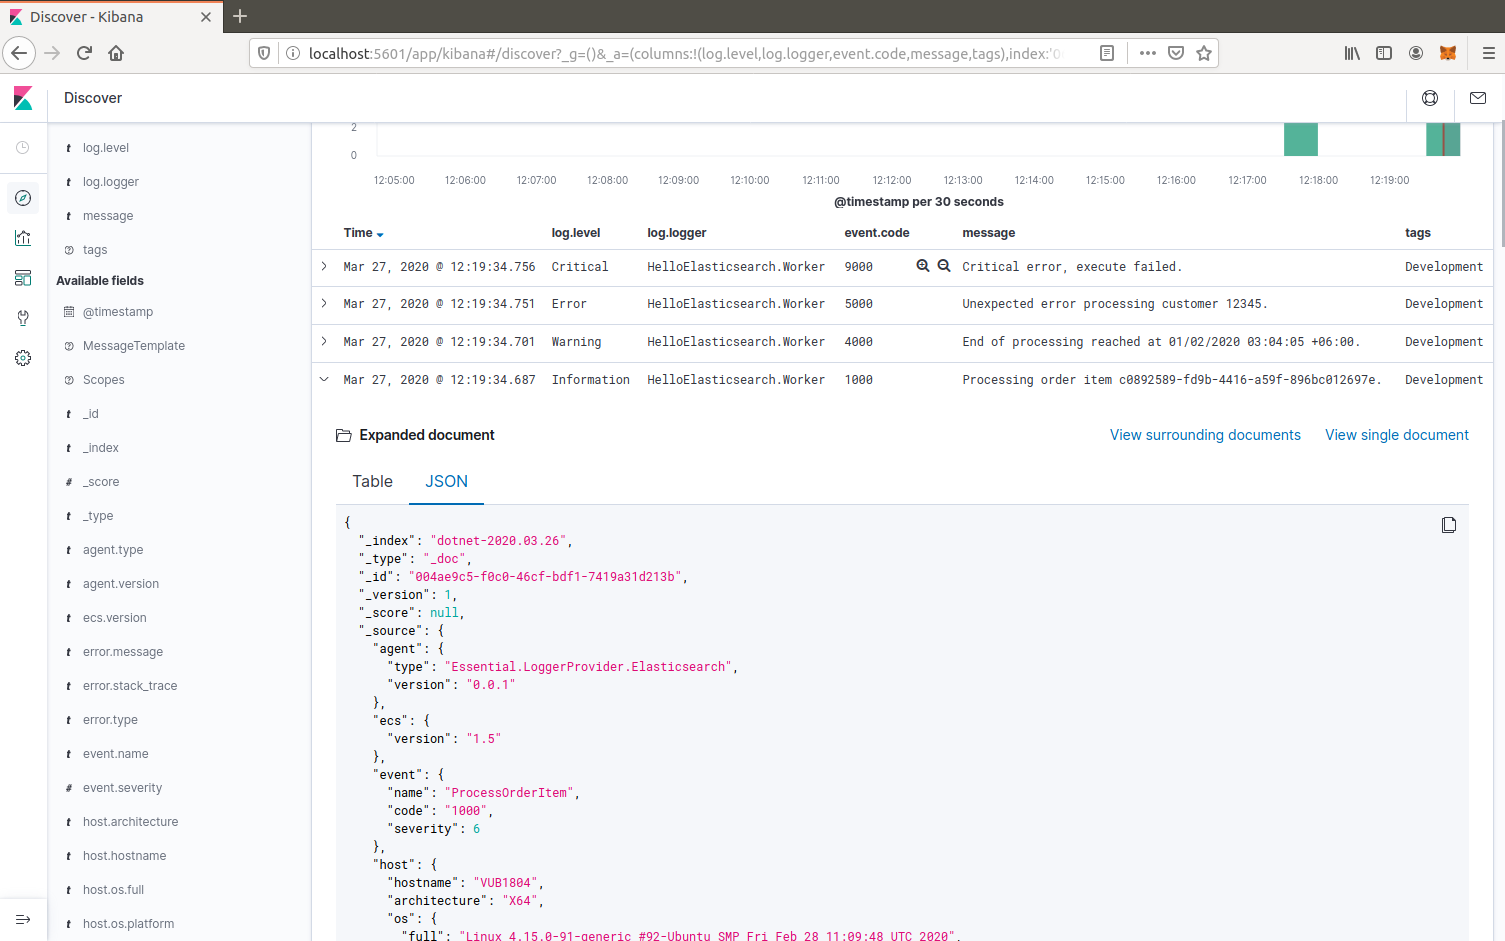
You can see this with a basic example, by configuring your logging to display the correlation identifier. Many logging systems, such as Elasticsearch, display correlation by default. The identifiers can also be passed across messaging, such as Azure Message Bus.

Logging has always been a useful way to understand what is happening within a system and for troubleshooting. However, modern systems are very complex, with multiple layers and tiers, including third party systems.

Trying to understand what has happened when a back end service log reports an error, and then correlating that to various messages and front end actions that triggered it requires some kind of correlation identifier.

This problem has existed ever since we have had commercial websites, for over 20 years of my career, with various custom solutions.

Finally, in 2020, a standard was created for the format of the correlation identifier, and how to pass the values: W3C Trace Context. In a very short amount of time all major technology providers have implemented solutions.

The examples below show how this is already implemented in modern dotnet.

Continue reading Modern distributed tracing with dotnet(5 min read)

Elasticsearch-Logstash-Kibana (ELK) LoggerProvider for .NET Logging(4 min read)

Note: The Elasticsearch logger provider has been moved to the ECS DotNet project.

Find the latest version here: https://github.com/elastic/ecs-dotnet/blob/master/src/Elasticsearch.Extensions.Logging/ReadMe.md

The nuget package is here: https://www.nuget.org/packages/Elasticsearch.Extensions.Logging/1.6.0-alpha1

To add the package to your project:
dotnet add package Elasticsearch.Extensions.Logging --version 1.6.0-alpha1

This ElasticsearchLoggerProvider, for Microsoft.Extensions.Logging, writes direct to Elasticsearch, using the Elasticsearch Common Schema (ECS), and has full semantic logging of structured data from message and scope values.

To use, add the Essential.LoggerProvider.Elasticsearch package to your project:

PS> dotnet add package Essential.LoggerProvider.Elasticsearch

Then add the logger provider to your host builder, and the default configuration will write to a local Elasticsearch service:

using Essential.LoggerProvider;

// ...

    .ConfigureLogging((hostContext, loggingBuilder) =>
    {
        loggingBuilder.AddElasticsearch();
    })

Once you have logged some events, open up Kibana (e.g. http://localhost:5601/) and define an index pattern for dotnet-* with the time filter @timestamp.

You can then discover the log events for the index. Some useful columns to add are log.level, log.logger, event.code, message, tags, and process.thread.id.

Structured message and scope values are logged as labels.* custom key/value pairs, e.g. labels.CustomerId.

Example: Elasticsearch via Kibana
Continue reading Elasticsearch-Logstash-Kibana (ELK) LoggerProvider for .NET Logging(4 min read)