In this post we will cover how to the the built in support for OpenTelemetry in modern .NET to instrument your distributed application for tracing and logging, how the OpenTelemetry Collector can be used to simplify instrumention, and how the OpenTelemetry Protocol is building a (brilliant) connected future.
We have already seen how distributed tracing is supported in .NET via W3C Trace Context propagation, with automatic (or mostly automatic) support across HttpClient calls and messaging.
We will now go further than logging and look at tracing. Tracing looks at the different units of work (spans) done during an operation (trace), how they are connected, and the timings of the different components. This is an important tool for investigating performance issues in distributed systems.
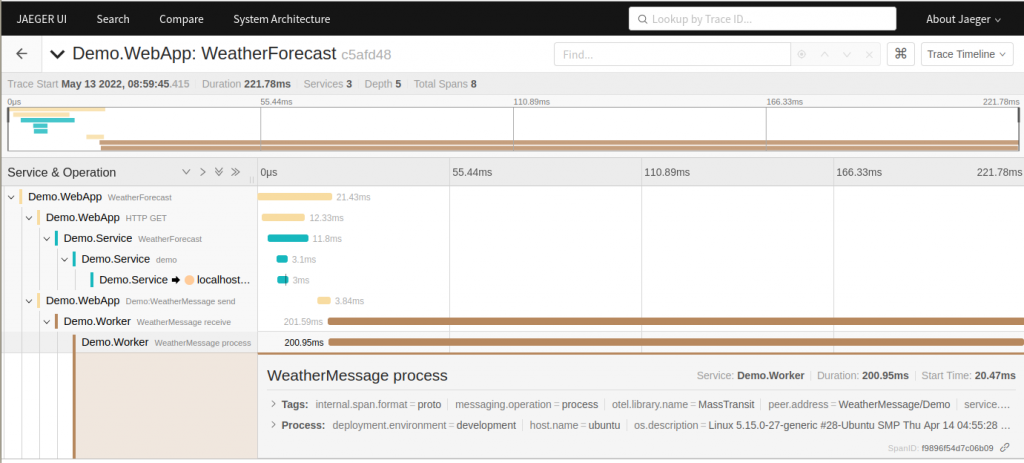
An example distributed trace timeline, across multiple components, viewed in Jaeger, one of many supported tools:
As well as looking at individual traces timings can be aggregated across the system to find the slowest areas, and identify anomalies.
Continue reading Instrumenting .NET with OpenTelemetry(15 min read)

