
In this post we will cover how to the the built in support for OpenTelemetry in modern .NET to instrument your distributed application for tracing and logging, how the OpenTelemetry Collector can be used to simplify instrumention, and how the OpenTelemetry Protocol is building a (brilliant) connected future.
We have already seen how distributed tracing is supported in .NET via W3C Trace Context propagation, with automatic (or mostly automatic) support across HttpClient calls and messaging.
We will now go further than logging and look at tracing. Tracing looks at the different units of work (spans) done during an operation (trace), how they are connected, and the timings of the different components. This is an important tool for investigating performance issues in distributed systems.
An example distributed trace timeline, across multiple components, viewed in Jaeger, one of many supported tools:

As well as looking at individual traces timings can be aggregated across the system to find the slowest areas, and identify anomalies.
What is OpenTelemetry?
OpenTelemetry is an industry movement that arose from the W3C Trace Identifier standardisation, and the combination of two open source projects OpenCensus and OpenTracing.
It provides an open source, vendor neutral framework for observability, supporting traces, metrics, and logs, and with automatic instrumentation provided out of the box.
OpenTelemetry is strongly supported by industry, and has been quickly implemented by many vendors in the instrumentation space, and supports many programming languages. Many platforms have made it (or are making it) the default for interoperability.
It is rare for a new standard to achieve such rapid acceptance, and I have been impressed by how fast OpenTelemetry has been adopted.
OpenTelemetry support in .NET
OpenTelemetry is supported in the core of .NET, with System.Diagnostics.Activity updated to be the .NET implementation of OpenTelemetry span.
System.Diagnostics.Activity supports the same operations and internal structure as span, althought it has kept the same name and interface as it is already widely used in .NET code. It supports W3C Trace Context identifiers and propagation, and OpenTelemetry tags, baggage, and events.
Internal systems, such as HttpClient, ASP.NET, and Azure Service Bus support activity (span) creation, types, and attributes.
There are plug in libraries that will automatically (no additional code) instrument Entity Framework, SQL Server, and other Microsoft components.
Many third party libraries also now either support OpenTelemetry directly (e.g. MassTransit), or have plug in instrumentation available (e.g. PostgreSQL).
Distributed tracing has also started being added to Azure, with one of the first services being IoT Hub distributed tracing for device-to-cloud messages, allowing you to trace IoT messages end-to-end.
Adding OpenTelemetry to your .NET project
One of the benefits of OpenTelemetry is the automatic instrumentation, so there is not a lot to do except reference the libraries and then set up the configuration.
Importantly, you don't need to make any changes to existing code to take advantage of the tracing, and if you are using the standard ILogger<T> interface for logging, then that also works.
Existing .NET code
Our example system consists of a web app, with a browser interface, that calls a back end service over HTTP. that then accesses a PostgreSQL database via Entity Framework. The web app also sends a message using MassTransit over a RabbitMQ message bus to a worker application.

The full complex tracing example is available in GitHub, and uses Docker engine to run RabbitMQ, PostgreSQL, and the Adminer interface for PostgreSQL.
Of important note is that the application code uses standard .NET, with nothing specific to OpenTelemetry, using standard LoggerMessage / ILogger<T> and HttpClient calls. In these examples the LoggerMessage pattern is used for high performance logging.
[HttpGet]
public async Task<string> Get(System.Threading.CancellationToken cancellationToken)
{
    Log.Warning.WebAppForecastRequestForwarded(_logger, null);
    var result = await _httpClient.GetStringAsync("https://localhost:44301/WeatherForecast", cancellationToken);
    await _publishEndpoint.Publish<Demo.WeatherMessage>(new { Note = $"Demo Message" }, cancellationToken);
    return result;
}
...
public static readonly Action<ILogger, Exception?> WebAppForecastRequestForwarded =
    LoggerMessage.Define(LogLevel.Warning,
        new EventId(4001, nameof(WebAppForecastRequestForwarded)),
        "TRACING DEMO: WebApp API weather forecast request forwarded");
The example uses the MassTransit library to call to RabbitMQ for messaging, but there is nothing specific to OpenTelemetry in any of the messaging configuration or handling code.
public async Task Consume(ConsumeContext<WeatherMessage> context)
{
    Log.Warning.WorkerMessageReceived(_logger, context.Message.Note, null);
    await Task.Delay(TimeSpan.FromMilliseconds(200), context.CancellationToken);
}
The back end service similarly has a straight forward implementation of Entity Framework calling to PostgreSQL:
public IEnumerable<WeatherForecast> Get()
{
    _weatherContext.WeatherServiceRequests.Add(new WeatherServiceRequest() {Note = "Demo Note"});
    _weatherContext.SaveChanges();
    Log.Warning.ServiceForecastRequest(_logger, null);
    ...
}
Instructions are provided on GitHub to create the sample application from scratch, or you can use the premade version.
Configuring OpenTelemetry
To use OpenTelemetry no change is required to any of the functional code of the application. We simply need to reference the OpenTelemetry libraries in the host, and then configure OpenTelemetry in the application startup builder, defining the resource, adding automatic instrumentation libraries, and setting exporters.
This example adds instrumentation for AspNetCore, HttpClient, and PostgreSQL. MassTransit already has built in support for OpenTelemetry. The Jaeger exporter is used. Note that some of the libraries are still in pre-release.
dotnet add Demo.WebApp package OpenTelemetry.Extensions.Hosting --prerelease
dotnet add Demo.WebApp package OpenTelemetry.Instrumentation.AspNetCore --prerelease
dotnet add Demo.WebApp package OpenTelemetry.Instrumentation.Http --prerelease
dotnet add Demo.WebApp package OpenTelemetry.Exporter.Jaeger

dotnet add Demo.Service package OpenTelemetry.Extensions.Hosting --prerelease
dotnet add Demo.Service package OpenTelemetry.Instrumentation.AspNetCore --prerelease
dotnet add Demo.Service package Npgsql.OpenTelemetry
dotnet add Demo.Service package OpenTelemetry.Exporter.Jaeger

dotnet add Demo.Worker package OpenTelemetry.Extensions.Hosting --prerelease
dotnet add Demo.Worker package OpenTelemetry.Exporter.Jaeger
To configure OpenTelemetry we first need to define the resource. In OpenTelemetry a resource represents an entity that is producing telemetry, such as a service, Kubernetes pod, device, etc. A resource has a number of properties such as name, version, and the OpenTelemetry library being used.
The OpenTelemetry specification defines resource semantic conventions for standard names of attributes.
In the code below we add the default attributes (name, version - taken from the semantic AssemblyInformationalVersion, and library), along with additional attributes, following the convention naming standards, for the host, operating system, and environment.
var entryAssembly = System.Reflection.Assembly.GetEntryAssembly();
var entryAssemblyName = entryAssembly?.GetName();
var versionAttribute = entryAssembly?.GetCustomAttributes(false)
    .OfType<System.Reflection.AssemblyInformationalVersionAttribute>()
    .FirstOrDefault();
var serviceName = entryAssemblyName?.Name;
var serviceVersion = versionAttribute?.InformationalVersion ?? entryAssemblyName?.Version?.ToString();
var attributes = new Dictionary<string, object>
{
    ["host.name"] = Environment.MachineName,
    ["os.description"] = System.Runtime.InteropServices.RuntimeInformation.OSDescription,
    ["deployment.environment"] = builder.Environment.EnvironmentName.ToLowerInvariant()
};
public var resourceBuilder = ResourceBuilder.CreateDefault()
    .AddService(serviceName, serviceVersion: serviceVersion)
    .AddTelemetrySdk()
    .AddAttributes(attributes);
During application build, we then add OpenTelemetry services and configure them with the resource, the automatic instrumentation, additional sources (in this case MassTransit), and the exporter we want.
Note: The code below registers all the instrumentation we are using; in practice each of the components may have different instrumentation, e.g. only the back end service is using PostgreSQL
builder.Services.AddOpenTelemetryTracing(configure =>
{
    configure
        .SetResourceBuilder(resourceBuilder)
        .AddAspNetCoreInstrumentation()
        .AddHttpClientInstrumentation()
        .AddNpgsql()
        .AddSource("MassTransit")
        .AddJaegerExporter();
});
And that is it. We don't need to change any application code.
Tracing results in Jaeger
When the project is run, you can see the full trace path of requests in a local Jaeger instance, which can also be run via Docker.
Start the dependencies (e.g. via Docker compose: docker compose -p demo up -d) and then run the application and make a few requests in the web interface. Then browse to the Jaeger interface to see the results at http://localhost:16686/
Select the service Demo.WebApp and search, which will show you a graph of all traces that service is involved in, along with some key details such as the number of spans and number of errors.
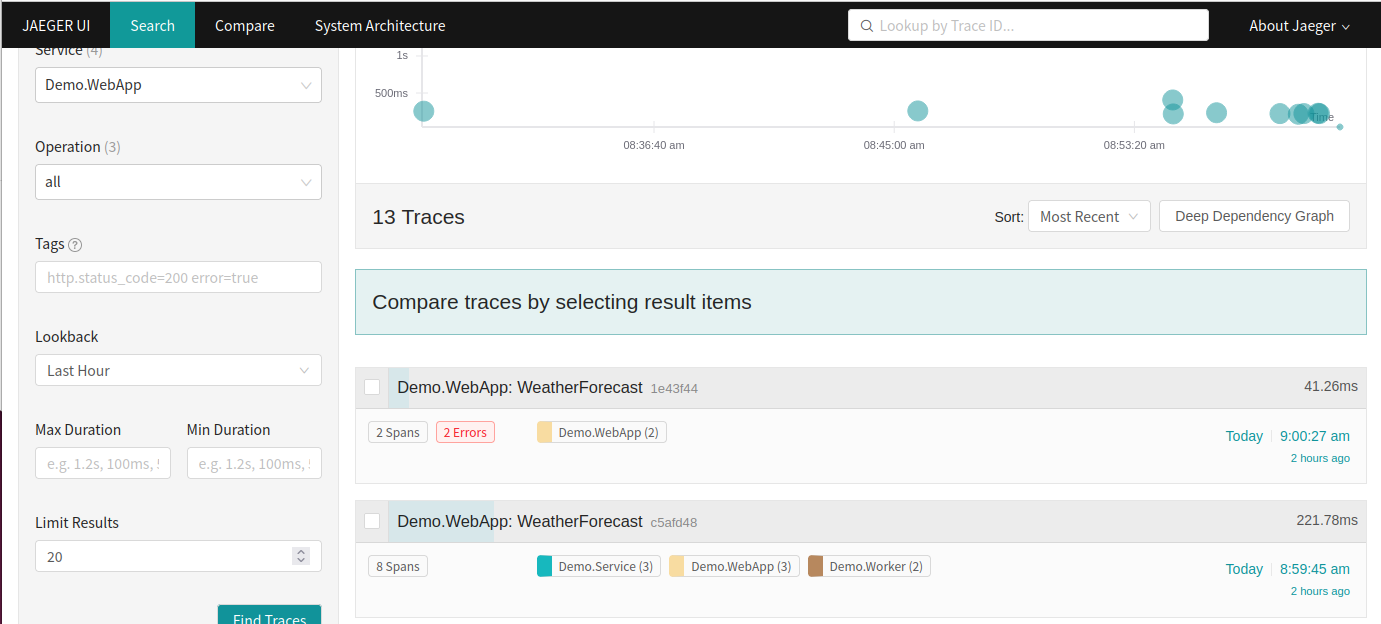
You can click into a trace (see screen at top of article) to see the full detail and timings for a single trace as it moves through the distributed application.
Tracing is useful to identify the depenencies between components, and for investigating performance issues to see where bottlenecks are.
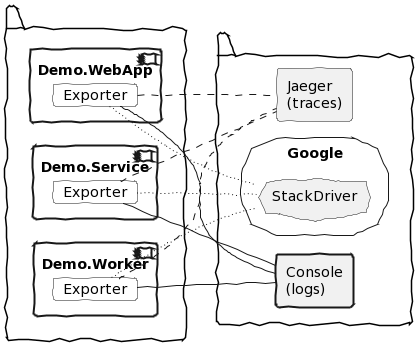
Displaying the system architecture
The trace relationships between components can also be used to generate a system architecture diagram, useful to understand which components call each other, and how frequently.
Being able to diagram the actual runtime dependencies in a complex distributed application is valuable in trying to understand the application behaviour.

Using the OpenTelemetry collector
Dealing with complexity
The standards include the OpenTelemetry Protocol (OTLP), which will simplify connections and provide interoperability. Many vendors already support OTLP, although the full specification is not yet standardised.
In the meanwhile, the OpenTelemetery collector can be used to simplify your configuration by handling OLTP and forwarding telemetry to different destinations.

Using a collector also has other benefits, as it can be used for local batching, sampling, and processing pipelines before forwarding events upstream.
The collector is written in Go, and can be run in a Docker container. It supports logs, traces, and metrics.
Aside: Without the collector
Using separate exporters and protocols for each destination, for each language (even if they all conform to the OpenTelemetry standards) is a many-to-many problem that we want to avoid.
Until all destinations support OTLP, we can avoid this by using the collector (above), which has more plug-ins available than individual language libraries.
Configuring the OTLP exporter
The full OpenTelemetry collector example is available in GitHub, with the same example application as above.
Docker compose is used to run Jaeger as a destination for traces and Loki + Grafana as a destination for logging. The collector is also configured to export to Azure Monitor / Application Insights.
When running the example the OpenTelemetry collector is then run directly in Docker.
To configure the basic application, first, add the packages for the OTLP exporter and OTLP logs exporter.
dotnet add Demo.WebApp package OpenTelemetry.Exporter.OpenTelemetryProtocol --prerelease
dotnet add Demo.WebApp package OpenTelemetry.Exporter.OpenTelemetryProtocol.Logs --prerelease

dotnet add Demo.Service package OpenTelemetry.Exporter.OpenTelemetryProtocol --prerelease
dotnet add Demo.Service package OpenTelemetry.Exporter.OpenTelemetryProtocol.Logs --prerelease

dotnet add Demo.Worker package OpenTelemetry.Exporter.OpenTelemetryProtocol --prerelease
dotnet add Demo.Worker package OpenTelemetry.Exporter.OpenTelemetryProtocol.Logs --prerelease
To configure the OTLP exporter requires the endpoint, processor type, and protocol; you can add these to the appsettings file for the environment, e.g. appsettings.Development.json. For example, to send to a local collector (running in Docker):
"OpenTelemetry": {
  "OtlpExporter": {
    "Endpoint": "http://localhost:4317/",
    "ExportProcessorType": "Batch",
    "Protocol": "grpc"
  }
}
Then, instead of the destination-specific Jaeger exporter, use the OtlpExporter when configuring OpenTelemetry tracing, binding the configuration to the appsettings section.
builder.Services.AddOpenTelemetryTracing(configure =>
{
    configure
        .SetResourceBuilder(resourceBuilder)
        .AddAspNetCoreInstrumentation()
        .AddHttpClientInstrumentation()
        .AddNpgsql()
        .AddSource("MassTransit")
        .AddOtlpExporter(otlpExporterOptions =>
        {
            builder.Configuration.GetSection("OpenTelemetry:OtlpExporter")
                .Bind(otlpExporterOptions);
        });
});
For OpenTelemetry logging, you also need to configure the OpenTelemetry logging provider. This needs the resource and the exporter, but no additional instrumentation as just hooks into the standard ILogger<T> pipeline.
When configuring the OpenTelemetry logger, you can enable formatted messages, scopes, and state values.
builder.Logging
    .AddOpenTelemetry(configure =>
    {
        configure
            .SetResourceBuilder(resourceBuilder)
            .AddOtlpExporter(otlpExporterOptions =>
            {
                builder.Configuration.GetSection("OpenTelemetry:OtlpExporter").Bind(otlpExporterOptions);
            });
        configure.IncludeFormattedMessage = true;
        configure.IncludeScopes = true;
        configure.ParseStateValues = true;
    });
As before, no change to application code is needed. Setting up the OTLP exporter is entirely done in the application configuration.
Azure Monitor preparation
You need to set up Azure Monitor and Application Insights instances to send telemetry to. The Github project includes a script to create the necessary Azure resources.
az login
$VerbosePreference = 'Continue'
./deploy-infrastructure.ps1
You can also create them directly in PowerShell using the Azure CLI:
az login

$OrgId = "0x$($(az account show --query id --output tsv).Substring(0,4))",
$Environment = 'Dev',
$Location = 'australiaeast'

$appName = 'tracedemo'
$rgName = "rg-$appName-$Environment-001".ToLowerInvariant()

$TagDictionary = @{ WorkloadName = 'tracingdemo'; DataClassification = 'Non-business'; Criticality = 'Low';
  BusinessUnit = 'Demo'; ApplicationName = $appName; Env = $Environment }
$tags = $TagDictionary.Keys | ForEach-Object { $key = $_; "$key=$($TagDictionary[$key])" }

az group create -g $rgName -l $location --tags $tags

$logName = "log-$appName-$Environment".ToLowerInvariant()
$appiName = "appi-$appName-$Environment".ToLowerInvariant()

az monitor log-analytics workspace create `
  --resource-group $rgName `
  -l $Location `
  --workspace-name $logName `
  --tags $tags

az monitor app-insights component create `
  --app $appiName `
  -g $rgName `
  --location $Location `
  --workspace $logName `
  --tags $tags
After creation you can log in to the Azure portal to check the logging components were created at https://portal.azure.com
Azure resource cleanup
When you are finished, the demo resources can be removed:
az login
./remove-infrastructure.ps1
Collector configuration
When the OpenTelemetry collector is run it uses a configuration file that directs how telemetry is routed.
This configuration specifies the receiver plugs to use and ports to listen to (OTLP), pipeline processors, and the exporters to send to (auzuremonitor, jaeger, and loki). Note that the azuremonitor configuration includes an environment variable, which is set from the deployed instance.
For local development, insecure connections are used (as the local endpoints don't have certificates set up).
receivers:
  otlp:
    protocols:
      grpc:
      http:

processors:
  batch:

exporters:
  azuremonitor:
    instrumentation_key: "${AZ_INSTRUMENTATION_KEY}"
  jaeger:
    endpoint: jaeger:14250
    tls:
      insecure: true
  logging:
    logLevel: info
  loki:
    endpoint: http://loki:3100/loki/api/v1/push
    format: json
    labels:
      resource:
        deployment.environment: "deployment_environment"
        host.name: "host_name"
        service.name: "service_name"
        service.namespace: "service_namespace"
      record:
        severity: "severity"
    tenant_id: tenant1
    tls:
      insecure: true

service:
  pipelines:
    traces:
      receivers: [otlp]
      processors: [batch]
      exporters: [logging, jaeger, azuremonitor]
    logs:
      receivers: [otlp]
      processors: []
      exporters: [logging, loki, azuremonitor]
Run the example
As the example includes many components, there is a helper shell script start-collector-demo.sh that uses tmux to partition the terminal and start all of the individual components running.
./start-collector-demo.shExample of running system:

Running components individually
You can also run each of the components in separate shell terminals (the Github code has PowerShell versions of these commands):
OpenTelemetry collector
az_instrumentation_key=$(az monitor app-insights component show -a appi-tracedemo-dev -g rg-tracedemo-dev-001 -o tsv --query instrumentationKey)
docker run -it --rm -e AZ_INSTRUMENTATION_KEY=$az_instrumentation_key --network demo_default -p 4317:4317 -v $PWD/otel-collector-config.yaml:/etc/otelcol-contrib/config.yaml otel/opentelemetry-collector-contrib:0.50.0
Web interface
ASPNETCORE_URLS="http://localhost:8002"
npm run start --prefix Demo.WebApp/ClientApp
Web app
version=$(dotnet gitversion /output json /showvariable InformationalVersion)
dotnet run --project Demo.WebApp -p:InformationalVersion=$version -- --urls http://*:8002 --environment Development
Service
version=$(dotnet gitversion /output json /showvariable InformationalVersion)
dotnet run --project Demo.Service -p:InformationalVersion=$version -- --urls https://*:44301 --environment Development
Worker
version=$(dotnet gitversion /output json /showvariable InformationalVersion)
dotnet run --project Demo.Worker -p:InformationalVersion=$version -- --environment Development
Collector tracing results in Jaeger
The tracing results can be seen in Jaeger, similar to first example.
Collector logging results in Grafana + Loki
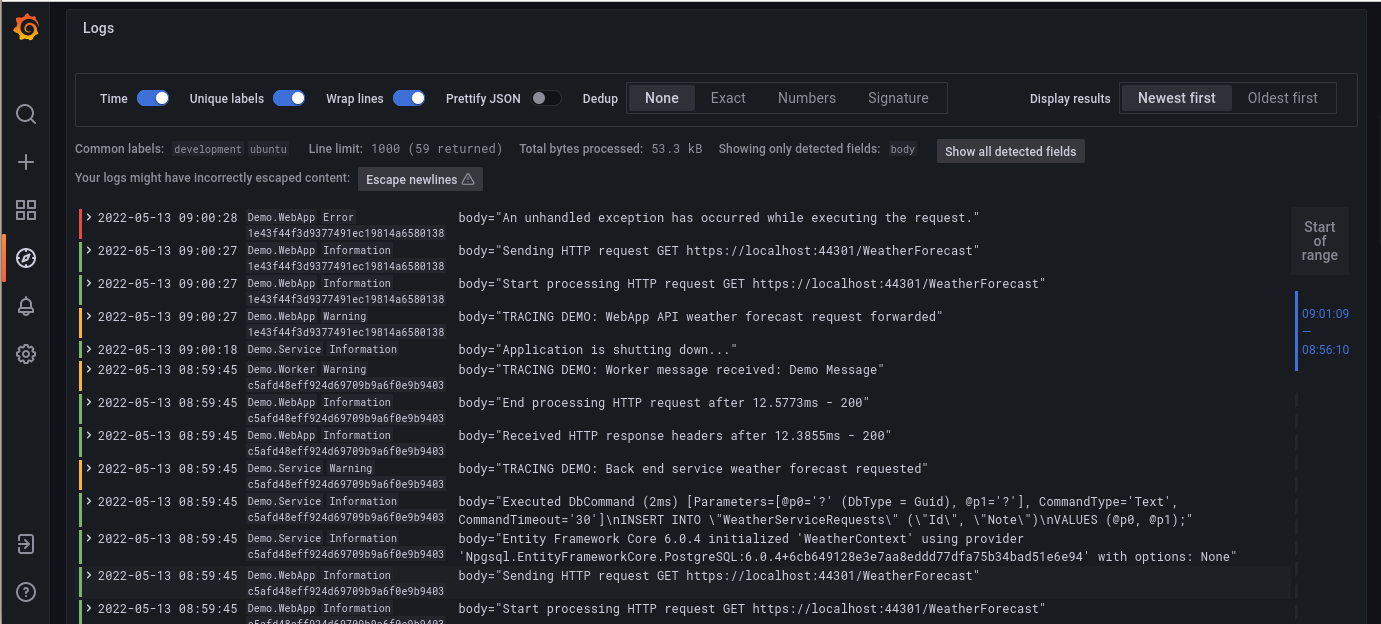
Logs can be seen in Grafana, from the associated Loki source. To show the Demo services and parse the trace ID from the JSON data, use the following query:
{service_name=~"Demo.*"} | json traceid="traceid"Turn on Unique Labels, which will show the other labels, including the parsed traceid, and then open one of the messages and select the "Show this field" icon (an eye) next to the body field.
This cleans up the display and shows key fields (the severity is also indicated in colour on the left), and the log message.
The LogQL pipeline can be used to further manipulate the output, for example use the following query to extract additional attributes from the JSON log entry.
{service_name=~"Demo.*"} | json traceid="traceid", id=`attributes["Id"]`, name=`attributes["Name"]`, version=`resources["service.version"]`, body="body" | line_format "{{.severity | upper}}: {{.name}}{{if .id}}[{{.id}}] {{end}}{{.body}}" | label_format id="", body=""See results in Azure Monitor
Logs are forwarded to Application Insights, for viewing in the Azure Monitor Log Analytics workspace. From the workspace, select General > Logs, and then use the following query to see your logs:
union AppDependencies, AppRequests, AppTraces, AppExceptions
| where TimeGenerated  > ago(1h)
| sort by TimeGenerated desc
| project TimeGenerated, OperationId, SeverityLevel, Message, Type, AppRoleName, Properties.SpanId, ParentId
Example output:

End-to-end transaction details
The telemetry also includes trace information, which can be used to analyse dependencies and timings in the Application Insights end-to-end transaction details.
In Application Insights, select Investigate > Performance in the left hand menu, then Operation Name "GET WeatherForecast/Get" (the top level operation requesting the page). The right hand side will show the instances. Click on "Drill into... N Samples" in the bottom right, then select the recent operation, to see the End-to-end transaction.

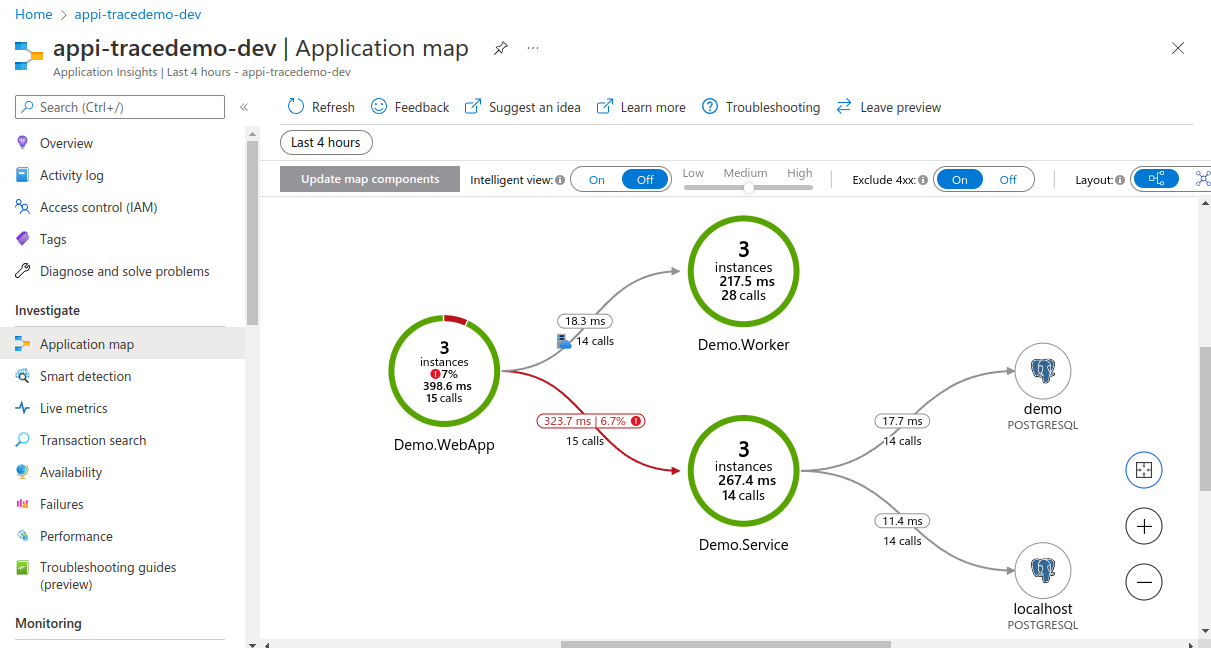
Application map
Application Insights can also generate an application map, similar to Jaeger, showing the tracing relationships between components, by selecting Investigate > Application Map in the left hand menu.
Next steps
Have a look at the example application, and see how easy it is to add OpenTelemetry support to your existing distributed applications, and the amount of diagnostic information that is available.
You can either configure OLTP, or custom, exporters for many instrumentation providers. Or set up an OpenTelemetry collector to forward logs and traces to a destination such as Azure Monitor.
In your local isolated development environment you can use Jaeger for tracing, and Loki + Grafana for logging, easily running these services in Docker, so that everyone on your team has the same set up.
You can further enhance your instrumentation by using ActivitySource to create your own spans around different parts of of our code that do not have automatic instrumention (and then register your source in the OpenTelemetry configuration).
OpenTelemetry also supports metrics, not covered in this article, which are also using for analysing application performance.