
With tabletop roleplaying game (RPG) systems, sometimes I hear a claim that bell curve dice rolls, e.g. 3d6, are “less swingy” (less variance) than a linear based dice roll such as d20 or d%.
This is, however, incorrect.
While the distribution of dice rolls are different, the distribution of outcomes – success or failure – are the same, and for equivalent circumstances have the same statistical variance / standard deviation.
Although the outcomes have equivalent distributions, the underlying type of dice system is important for analysis of modifiers and skill progression.
Dice probability distributions
RPG systems use many different resolution mechanics, from simple to complex, from diceless to card based, with various sized standard dice, or sometimes custom dice.
Examples are provided comparing three common types of system, all of which have free downloadable quick start rules if you want a closer look:
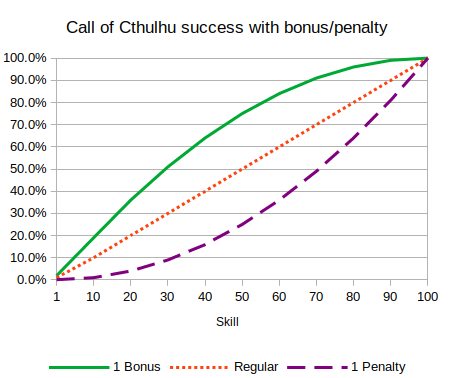
- Linear – Call of Cthulhu (https://www.chaosium.com/cthulhu-quickstart/),
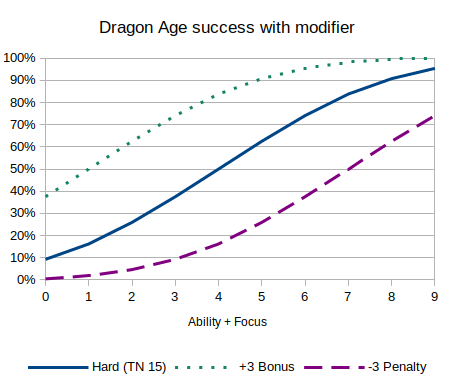
- Bell curve – Dragon Age (https://greenronin.com/dragonagerpg/#tab-id-2), and
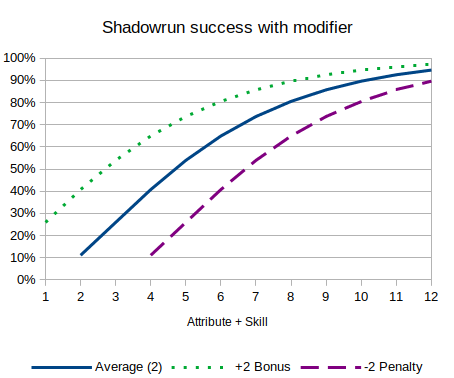
- Dice pool – Shadowrun (https://www.shadowruntabletop.com/downloads/).
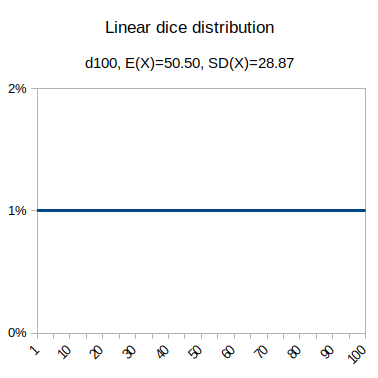
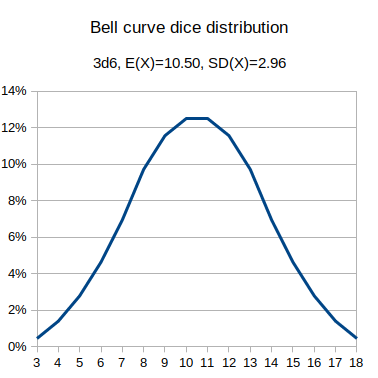
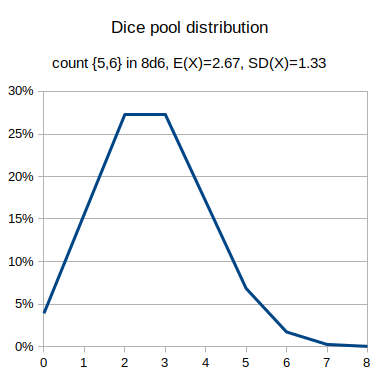
The graphs include the expected value and the standard deviation ("swingyness"). You can verify these dice probability distributions using a tool like AnyDice, https://anydice.com
output d100 named "output d100 named "Linear d100 distribution"
output 3d6 named "Bell curve 3d6 distribution"
output [count {5,6} in 8d6] named "Dice pool 8d6 distribution"
Success by skill level graphs
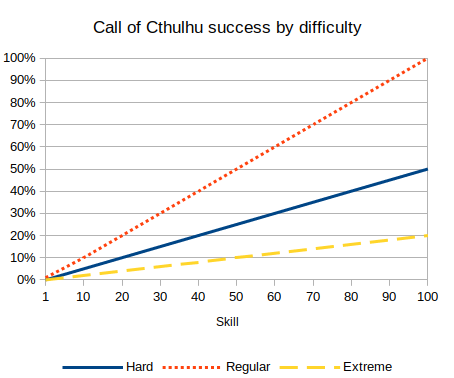
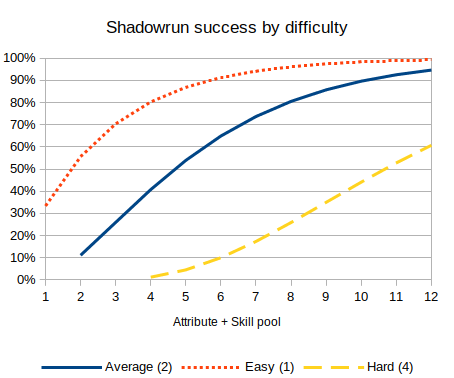
While the dice distribution is one thing, what is generally relevant is the probability of success for given criteria. As skill goes up, or difficulty goes down, the chance of success increases, and we can show a graph of the cumulative chance of success.
We can graph the chance of success, for a given difficulty (Cthulhu hard test, Dragon Age target number 15, Shadowrun threshold 2), against different skill levels, for each type of dice system:
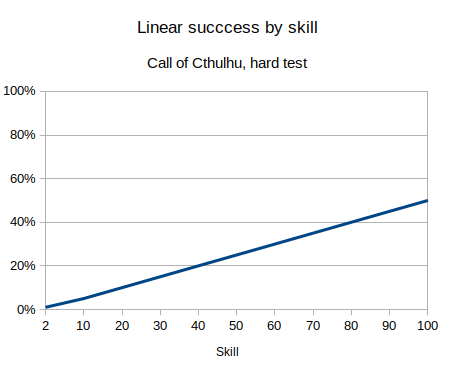
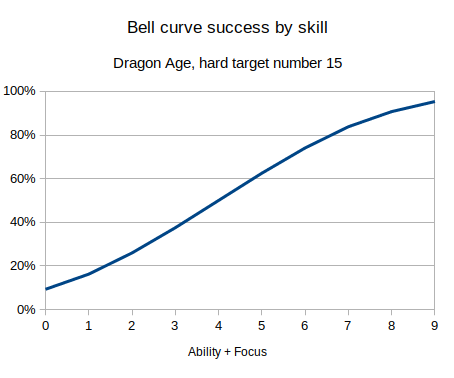
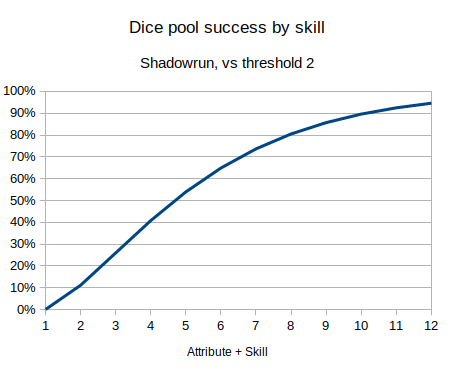
These three graphs are the three typical patterns for how you see chance of success increase by skill. A linear dice roll gives a linear increasing probability, bell curve gives an S-type shape, and a dice pool has the top half of the S-shape (or inverse logarithmic type shape).
Note that these are not probability distributions, but the probability of success under different circumstances.
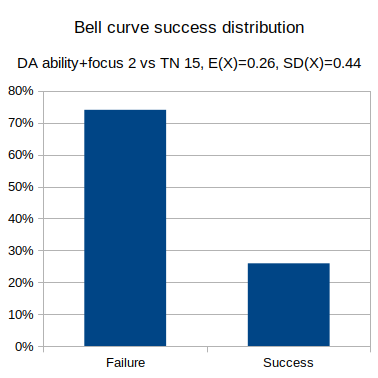
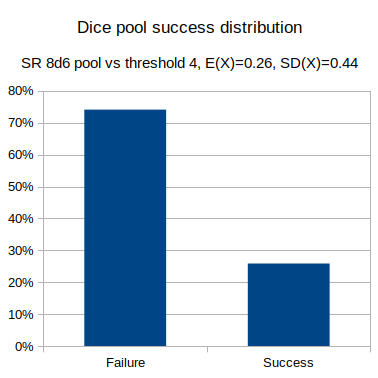
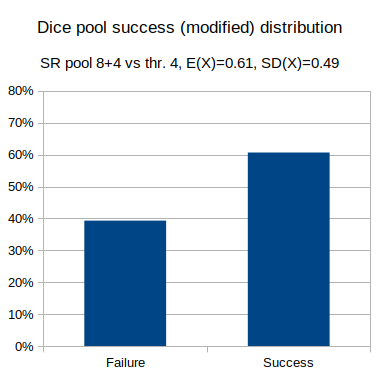
Success probability distributions
For any given test, the test is a certain difficulty, and the character has a particular skill level, and we can determine the chance of success or failure outcome.
We can graph the probability distribution of outcome results, as well as calculate the average and standard deviation, for each of the different dice systems.
- Linear: Call of Cthulhu, skill 52% hard test (half skill).
- Bell curve: Dragon Age, ability + focus 2 vs hard test (target number 15).
- Dice pool: Shadowrun, attribute + skill 8d6 vs hard test (threshold 4).
These can be generated in AnyDice, including the statistical values, using the following:
output d100 <= 52/2 named "Linear success distribution"
output 3d6 + 2 >= 15 named "Bell curve success distribution"
output [count {5,6} in 8d6] >= 4 named "Dice pool success distribution"
The distribution of the results is binomial, and in equivalent circumstances has the same distribution, irrespective of the distribution of the underlying dice roll system.

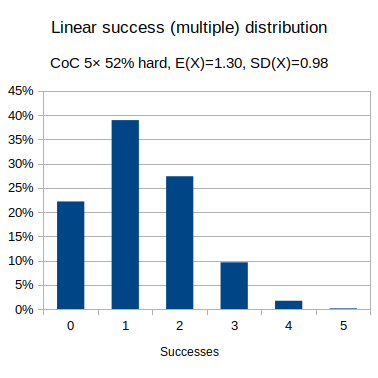
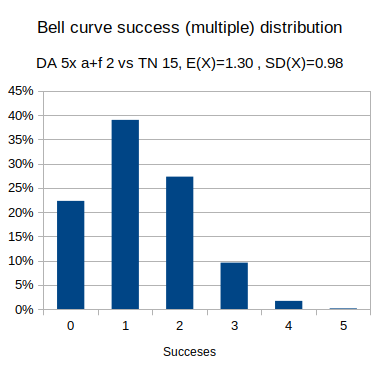
Multiple tests
Where there are multiple tests, such as a combat sequence, where the tests are equivalent, then the results (how many times you succeed), follow that binomial distribution and are also equivalent, irrespective of the underlying dice mechanic.

To verify the different dice systems producing the same outcome probability distribution in AnyDice:
function: five X { result: X+X+X+X+X }
output [five d100 <= 52/2] named "Linear multiple success distribution"
output [five 3d6 + 2 >= 15] named "Bell curve multiple success distribution"
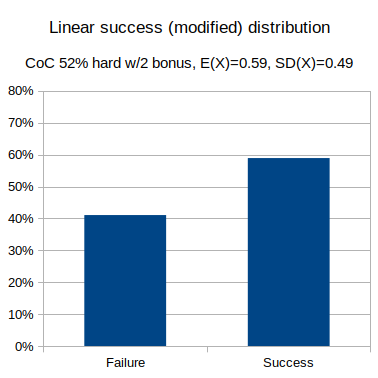
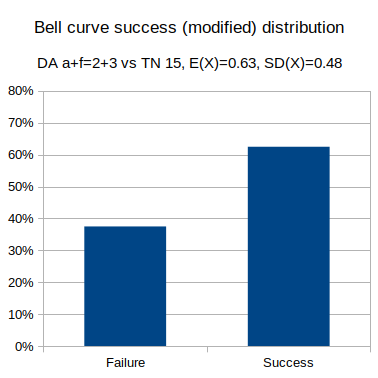
output [five [count {5,6} in 8d6] >= 4] named "Dice pool multiple success distribution"Effects of a specific modifier
The effects of an equivalent modifier likewise produce equivalent binomial distributions.
- Linear: Call of Cthulhu, skill 52% hard test (half skill), with 2 bonus dice
- Bell curve: Dragon Age, ability + focus 2 vs hard test (target number 15), with a +3 modifier.
- Dice pool: Shadowrun, attribute + skill 8d6 vs hard test (threshold 4), with +4 bonus dice.
To check these modifiers in AnyDice:
output 3@3d{0..9} * 10 + 1d10 <= 52/2 named "Linear with modifier success distribution"
output 3d6 + 2 + 3 >= 15 named "Bell curve with modifier success distribution"
output [count {5,6} in (8+4)d6] >= 4 named "Dice pool with modifier success distribution"
Distributions are the same
Equivalent graphs have been shown three times in a row, to emphasise the point that all three systems have the same binomial distribution of outcomes (success or failure), even though the underlying dice systems are different.
Using 3d6 is not less (or more) swingy than d100 due to the dice, although the probabilities will of course vary due to other differences in the systems, such as how skills or modifiers are calculated.
So, how is the dice system relevant?
While it doesn’t have an impact on the probability distribution of success outcome, the dice system does have an effect on how modifiers vary, skill progression, and on the margin of success.
Skill progression
An important tool for analysing a game system – for different difficulties (easy/average/hard) how often do you want characters to succeed across varying level of skill, given the style of the game.
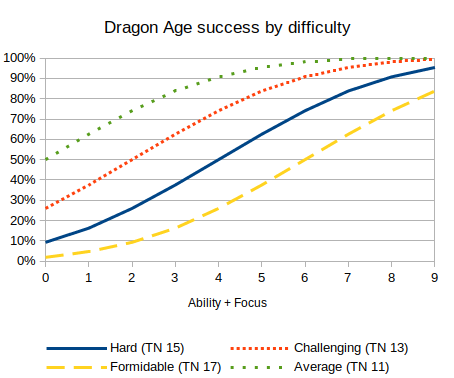
These can be used to analyse if tests in the system are too easy or too hard, or guide the gamemaster's choice of difficulty. e.g. even an expert is going to fail more than half the time for a hard test in Call of Cthulhu, whereas even a novice has a fair chance of success for an average test in Dragon Age.
The graphs can also be used to detect any anomalies, where a higher skill has a lower chance of success. An example is Savage Worlds where against a target number of 6, a skill of d4 has a better chance of success than a skill of d6.
Note these graphs can't be created directly in AnyDice. The best you can do is use a Transposed Graph to show the range of success (and failure) values for a single difficulty.
loop P over {1,10,20,30,40,50,60,70,80,90,100} { output d100 <= P named "[P]" }Make sure you use View = Graph and Data = Transposed to make sense of the data.
How modifiers vary
Rather than look at different difficulty levels, you can also look at what effect bonuses and penalties have.
These graphs are most useful when bonuses and penalties use a different mechanic than difficulty. For example, in Call of Cthulhu you get bonus (lowest of) or penalty (highest of) dice for the 10's placeholder, adding a non-linear effect, and Shadowrun gives you bonus or penalty dice (rather than change the threshold).
For systems with flat modifiers, such as Dragon Age, the graphs for bonuses and penalties, by skill, and by difficulty, are all the same, just shifted left or right.
Degree of success
While whether you succeed or not is a binomial distribution, the degree of success – how much you succeed by, sometimes called margin of success – can have a variety of distributions.
Where the system has the notion of critical successes or critical failures, can give an idea of how frequently they will occur and if the fits the intended style of the game.
The distribution of degree of success may be quite different from the system used to generate success or failure, e.g. Dungeons and Dragons has a flat d20 for success checks, but damage often has multiple dice and so is bell curve shaped; in contrast Dragon Age uses 3d6 but the "Dragon Die" for size of effect is a flat d6.
Alternative system design
Any time there is a success/failure outcome it is a binomial system, irrespective of the dice roll or other system (e.g. cards) used. Degree of success modifies this along a single axis, with some games having more complex resolution systems.
Some systems have both success/failure and advantage/disadvantage determined by the roll, leading to combinations where you might succeed but at a cost (success + disadvantage), or fail but with a benefit (failure + advantage).
The Genesys system has custom dice with different symbols for success and advantage, while Powered by the Apocalypse has outcomes for failure, success at a cost, and success.
Another example is Cortex Prime, where an action can succeed or fail, but any 1's rolled can also be turned into conditions; Shadowrun has a similar system with glitches. Even Dungeons & Dragons has an advanced "Success at a Cost" rule in the Dungeon Master's Guide, where a roll can both succeed and produce a penalty.
Outside of random numerical resolution (Fortune), game systems can use straight ability comparison or point spending systems (Karma), or a negotiated story-based result (Drama).
For example, in Gumshoe you either have an investigative skill or don't; and in the old Amber RPG the highest statistic always wins. Drama based systems range from escalating negotiated statements in Polaris: Chivalric Tragedy at the Utmost North to the pictorial card deck used for subjective outcome determination in the Everway RPG.
It’s unfortunate that most people are so math-challenged, that you needed to run brute force calculations and provide 3 graphs to prove that if you have a 50% chance of success, it doesn’t matter if you roll d20, 3d6, or d100 – you’re odds of success, are still 50%. I suspect people who think 3d6 is less “swingy” than d20 because they are much more likely to roll a 1 on d20 than a 3 on 3d6 won’t be convinced by your graphs – if they could interpret them, they wouldn’t need convincing in the first place… That said, dice with a linear distribution are “swingy” in that they are terrible at handling modifiers in situations when the base odds of succeeding are over 80% or under 20%. This probably doesn’t matter in fantasy genres or heroic games, but it is a particularly thorny problem in “gritty” “realistic modern” or “hard SF” RPGs. Those games are often “crunchy”, with lots of combat. With the advent of automatic weapons, firefights basically became pitched battles between opposing sides hiding in cover (nobody wants to die), exchanging low probability of success gunfire. Once one side is suppressed or breaks, the other side leaves cover with relative impunity, to close in for a high percentage point-blank kill. This has been SOP for almost a century now and with no end in sight. It’s very difficult to model this with linear dice distributions – frankly, using d20 or d100 in that instance, is a terrible mistake and frankly, just asking for a trainwreck. A -10 DM for light cover and -20 DM for heavy cover is often meaningless when units have an 80% chance of hitting. But if your base chance to hit is 20%, those DMs are massive. So do you start halving, quartering, doubling odds? Those are very coarse modifiers that are also grossly inaccurate. The only way to attain believable results is to use decimal multipliers, like x0.8. The beauty of bell curve dice is that +1 or +2 DM smoothly scales along with the odds of success or failure. We observe this behavior when you shift the median time and time again in the real world. In statistics, almost all random samplings of populations follow a normal distribution – whether your histogram is for North American consumer spending habits or the air-speed velocity of African swallows… So why not use a dice system that provides a normal distribution? Even as you shift the median result (+ or – DM), it remains a normal distribution – just as in real life…
Michael,
Whoa there cowboy! First off lets go easy on the mathematically challenged. I think the reason most people don’t get the underlying math is that in the real world, (home, jobs, daily life), the vast majority of people don’t even use it. Thank the education system, calculators and the industrialization for that. Henry Ford doesn’t need mathematicians to tighten down the seat, Amazon isn’t hiring statisticians to deliver packages. Common Core is designed to provide workers, not thinkers. On the other hand, do you know how to make lavened bread from soil and seed? Properly temper a knife you hammered yourself in a homemade coal forge? Unlikely because they sell Wonder Bread and knives so inexpensively. : ) Nuff said.
On to the real discussion. You stated:
‘The only way to attain believable results is to use decimal multipliers, like x0.8’
Hum..???… I think your right.
If I remember correctly CoC 7ed and Mythras attempts to address the -20% ‘high meaningless, low skill massive’ by tests which are a fraction or multiple of your base skill. Like hard being 1/2 skill so a 50% skill becomes 25% and a 20% skill becomes 10%. What I don’t like how it penalizes high skill characters much more than low skill characters. A master with 100% who would normally succeed 9.5 out of 10, (96-00 always fails) now fails 5 out of 10 times while a stooge, (20%), who normally fails 8 out of 10 times now fails 9 out of 10 times.
Your x0.8 solves this but becomes math intensive at the table. “You have 77% skill with a x0.8 mod for range, x0.5 mod for cover and x1.5 mod for the ‘seeker’ spell on the arrow.
I am not good enough at math to think of an easy way to overcome these multiple mods in play. Any ideas?
So the bell curve of 3d6 does seem to work better for mods than a % system. What you lose is granularity and steady skill progression. Each point of skill gained is now referenced to your current skill. 1 point will have a value 0.46 to 12.5. A single ‘bit’ of information learned by someone in the middle, (such as the names of a couple demons for a sorcery skill), might increase his skill chance by 0.46%, (2 skill becoming 3 skill using 3d6), or 12.5%, (10 skill becoming 11 skill using 3d6). It is also far less obvious that if I have a 12 skill on 3d6 that it equals a 74% chance than 74 Skill equaling 74% using a percentile roll. I believe we tend to think in ‘slices of pie’ more than bell curves.
Perhaps skills increasing as percentages yet rolled on 3d6 to the nearest percentage would work better when modifiers are applied? Either that or still rolled on percentile dies but your fractional modifiers would be charted out for ease of use. That’s gonna be a big chart to cover all the 100 skill levels and multiple mods.
I have also though about things like Stat Tests being based upon the highest Stat in the contest rather than a static 3d6 under roll or a Resistance Table, (Basic Roleplaying), where each point of difference equals a 5% modifier.
1-5 = 1d6, 6-11 = 2d6, 12-17 = 3d6, 18-23 = 4d6, etc; Where the the highest Str is always at least 1 point above the maximum die roll. All 1’s is always a success and all 6’s always a failure. Thus when when a giant with Str 30 is arm wrestling a Hobbit with Str 8 they both roll 6d6. Winner is the one who rolls highest but also under their Str. Its not so much for the contests of 8 vs 30 as it is for 25 vs 30. A mechanism where each point is a 5% modifier means a 6 vs 12 is the same as a 12 vs 18, 20 vs 26 or a 100 vs 106. This is fine IF each point is significantly higher than the previous in terms of its value where a 106 Str carries twice as much weight as a 100 Str, (being equivalent to 6 vs 12 or 12 vs 18), but fails if the points are of equal value. Also, the mechanism of dding the result to a die roll such as 1d20 + Str where the highest result wins is fine when a 6 vs 12 but not when a 20 vs 39 or 100 vs 106.
This came up when I was designing a d100 campaign which revolved around warring giants of various clans and types and realized the mechanism for resolving Stat vs Stat battles was not very good.
Any thoughts on this?
Thanks for your insights and input!
Mike
The multiple size d6 pool roll under mechanic seems a little complicated, with varying dice pool sizes, roll under, compare highest, plus special rules for 1’s & 6’s (in most cases irrelevant), but an interesting way to preserve 50/50 chance between two arbitrarily high similar scores, while preserving differences at lower scores.
Most systems have trouble comparing both 8 vs 9 and 80 vs 90; using a different dice range would be one approach.
Ignoring details (like all 1’s, ties, what if you both fail, etc), the probabilities can be calculated by breaking the rolls at the shared (lower) range where the probabilities are 50/50.
e.g. For Str 25 vs Str 30 with 6d6.
You can get the probabilties from AnyDice `output 6d6`
This is easiest layed out in a table:
A (Str 30) has a 67% chance to win, B (Str 25) has a 32.5% chance, so about 2/3 vs 1/3 chance.
In contrast with a Str 8 hobbit, the chance of rolling less than 8 on 6d6 is 0.02%, so their chance of winning is almost zero.
The upper end is always small (as the dice changes to be just higher than the maximum), so the key is the lower scored participant gets 50% of the shared chance (which is the lower chance vs the entire dice range).
Example 1: Str 15 vs Str 20, with 4d6, the shared (< 15) is 66% chance, of 0.56 * 0.56 * 0.5 ~ 16% chance for Str 15 to win.
Example 2: Compared to Str 55 vs Str 60, with 11d6, where the chance is 0.998 * 0.998 * 0.5 ~ 50%; the chance of both rolling under 45 on 9d6 is almost certain, so it is a straight 50/50 contest.
So, if the lower score is about half the maximum dice range, the shared chance will be about 50%, giving the lower score a 25% chance to win. Lower scores will be less than 25%, and higher scores up to 50% (both non-linear changes).
A lot depends on what the system is trying to achieve, e.g. in D&D, a game of heroic fantasy where individual heroes can defeat mighty monsters, they use bounded accuracy with a linear systems: the halfling hero could very well have Strength 20, and the cloud giant only Strength 27, so comparable, especially if the halfling has proficiency in athletics. This is the kind of movie / heroic action scene, and as everything is kept within a small range, comparing two giants is also easy.
The other end is having a scale system, e.g. Savage Worlds heavy armor and heavy damage, where normal weapons simply can’t hurt tanks (at all) and two tanks just compare normal weapon ratings. Cortex Prime has something similar with Scale Die, but also allows heroics (as characters can spend plot points to include extra dice).
It is only not less swingy for tasks that succeed or fail around the median. For tasks that one has a good chance pf success at (say need a 5 or higher), 3d6 gives a far greater chance of success than a d20, and for difficult tasks (require a 15 or higher), have a far less chance of success.
It is these outliers that have designers cry “too swingy” for d20s. Why would your character who has trained for years, have a 25% chance of failure at getting a 6, and a neophyte still has only a 50% of failure at the same task?
Different distributions do have different probabilities of success. e.g. Rolling 15 or higher on 1d20 has an 30% chance of success vs Rolling 5 or higher on 3d6 has a 9.26% chance of success vs Rolling 5 or higher on 1d100 has a 86% chance of success.
But these aren’t comparing the same thing.
A task that is “difficult to complete” in a 3d6 system, requiring 15 or higher, is equivalent to 92 or higher in a d100 system (or a 19 or higher in a d20 system).
Yes, a task that is “average to complete”, e.g. 51 or higher on d100, will have a higher variance than “difficult to complete”, e.g. 92 or higher on d100.
output d100 >= 51 named “51/d100 success distribution” \ p=0.50, sd=0.50 \
output d100 >= 92 named “92/d100 success distribution” \ p=0.09, sd=0.29 \
But that has nothing to do with the dice rolled, but with it being closer to a 50/50 chance.
Whether a neophyte has a 50% chance of failure vs a trained character having 25% chance of failure is entirely based on how the system defines neophyte vs trained, and nothing to do with the dice used.
Mention by https://ropeblogi.wordpress.com/2021/12/11/teori-innblikk-38/
[…] is not less swingy than d20, https://sgryphon.wordpress.com/2020/10/15/3d6-is-not-less-swingy-than-d20/, snakkar om grunnleggande […]
Thank you for your article.
Two questions from a math-challenged reader :
1)To say that a character has a 75% chance of succeeding in a certain action (regardless of the dice system) means that if that character attempted that action a very large number of times, we would find that he or she would statistically succeed in about 75% of the observed cases (law of large numbers), but how is this relevant to a TTRPG game ?
A character only attempts the same action a very limited number of times during the game, the number of throws is very low, besides if the character’s survival depends on whether or not she succeeds on the very next throw, how is it relevant to know that she has 75% cases in her favor on a very large number of attempts of this type of action ? Since probability calculations never tell me anything about the very next throw, but rather about a large set of throws (a set that is never actually considered in the course of a game and is somehow “contradictory” to the sequence narrative flow of a TTRPG ).
2) Is there no difference between 3d6 and 1d20 in the rate at which the probabilities approximate the observed statistics, again for a large number of throws?
For an action with a 75% success rate, is the very large number of throws required to observe that statistically about 75% of the cases obtained were indeed favorable (modulo a margin of error to be defined around those 75%) the same with 3d6 or 1d20?
Do the statistics stabilize at the same speed around the probabilistic projections?
Thank you for your clarifications.
No problem. Thanks for commenting.
1) Yes, a success probability of 75% (e.g. DC16 in a d20 based system, after all adjustments have been added), means that for a large number of attempts 3/4 of them will succeed and 1/4 will fail.
While not directly relevant for a single test (at least no more than claiming something is “swingy”), over a course of a game that same DC16 test will come up a lot, e.g. hitting AC 16, a DC 16 test to jump, etc.
It is relevant mostly to TTRPG game design, such that it sets the tone of the system — if an averge character suceeds a lot it has more of a “heroes win” tone, but all the time might be boring. The failure chance is how often bad things will happen / characters fail / unexpected plot twists.
During a game it also informs characters whether the activity they are going to take is risky (hopefully high risk/high reward) or a safe bet. Yes, you might suceed at a high risk task (or fail at a low one), but if you want the character to be cautious you may chose the lower risk/reward activites (their wins won’t be as high, but they will fail/twist less).
The main point of the article was however, a counter to the common adage that a d20 system is too ‘swingy’ compared to a 3d6 system… which is not true is the statistical sense.
There are differeneces, e.g. they may be affected differently by modifiers (a static +1 has a bigger effect in the middle range of a 3d6, but less at the ends), but ‘swingy’ isn’t relevant.
2) They are the same; the system used to generate the binomial result make no difference.
A binomial system ‘stabilises’ (usually measured by standard deviation / variance; or expressed as a confidence interval) at the same rate, irrespective of the underlying mechanism of generating the result.
Effectively, whether you are rolling 3d6, 1d20, a pool of dice, drawing cards, or picking out of a hat, if you have a 75% chance to succeed (after all modifiers) you could replace the source of randomness with a computer generated if random() < 0.75 (where random() generates a random number between >= 0.0 and < 1.0). Then, 100 trials has 75 expected success with a standard deviation of 4.33; a 95% confidence interval for 100 trials with 75 success is 0.75 +/- 0.745 (i.e. 0.657 - 0.8245) 1000 trials has 750 expected with a standard deviation of 13.69 (10 times the size, but standard deviation only increased 3x); a 95% confidence interval for 1,000 trials with 750 successes would be 0.75 +/- 0.0258 (i.e. 0.7222 - 0.7758), much narrower. But, like the probability for a single throw, these are all in advance. It is possible to generate 100 (or 1,000) failures in a row -- just very unlikely.
I literally just got through explaining this to people a few days ago, and then someone found this and linked it just now in relation to such.
Unfortunately, this is what you get when people have a love of “beautiful math” but they don’t actually understand the math they’re using and what it actually represents. As stated, the bell curve disappears as soon as you boil it down to a binary “success/failure” mechanic.
You DO get a bell curve with D&D’s 3d6 for attributes, because every single output is valuable. If you just take D&D’s 1d20+X modifier and turn it into 3d6+X, then the bell curve is only a mirage, and the only thing you’ve accomplished is making it more difficult to understand your chances of attaining that binary success.
What’s more frustrating… is they KNOW this is the case, because they balance the game around the % chance of each outcome. It doesn’t matter if there’s a 1d100 or 10d10, a 57% chance is still a 57% chance, and they balance their games doing exactly that, but then insist the bell curve is magically somehow making one 57% chance more consistent than the other 57% chance. No, it isn’t. You know it isn’t, or you wouldn’t have made it a 57% chance in the first place. What are you even doing?
It’s frustrating to watch, because they could do really interesting things with a bell curve, but instead all they do is create another linear 2-point graph except it’s now very difficult to tell what a +2 bonus gives and the GM can’t figure out what the actual difficulty is any longer without either a cheat sheet or a calculator.
First, very nice nitpicking of irrelevant systems that just happen to have stupid DC distributions. Try using GURPS vs D&D5e next time. Second: You fundamentally misunderstand what people mean when they say “swingy”. 3d6 is objectively less “swingy” than a d20 because the extremes of the range are going to be much rarer, which is what people mean by “swingy”. They’re not talking about whether they succeed more often or not. A 50% chance is the same on any kind of dice.
The results are similar irrespective of the system. D&D is a flat system, similar to Cthulhu, and GURPS uses 3d6, the same as Dragon Age. And I’d hardly name Call of Cthulhu an irrelevant system. Many systems are are similar, I just picked three arbitrary ones with different starting probability curves.
If you want the stats in your favourite system, they can be easily calculated:
output d20+5 >= 11 named "D&D 5e linear success distribution, skill +5 vs DC 11"output 3d6 <= 8 named "GURPS bell curve success distribution, skill 8"
Yes, rolling a 19 in 5E (5%) is more likely than a 5 in GURPS (2.8%), but the actual number rolled doesn't matter; the game only cares if it was a success or not. Yes, the dice roll might be more swingy (as people talk about), but the results are not.
The mechanism design does have an impact on things like critical rate, and also how modifiers affect the system, i.e. does a single modifier step have a small or larger (or one then the other) as your skill level goes up.
I appreciate your posting this, and it will no doubt come as a surprise to many RPGers. I think some of the confusion is definitional, where swinginess refers to ‘crits’ rather than to mere success/failure. And for folks who don’t want, for example, 10% of rolls to be auto-hits or auto-misses, a 1d20 resolution mechanic just isn’t granular enough.