
Earlier this year the W3C Trace Context Recommendation was finally published. A standard way of passing distributed trace correlation has been needed for a long time, and it is good to see there is finally a standard, and many vendors have already moved to adopt it.
The Recommendation defines what a distributed trace is:
A distributed trace is a set of events, triggered as a result of a single logical operation, consolidated across various components of an application. A distributed trace contains events that cross process, network and security boundaries. A distributed trace may be initiated when someone presses a button to start an action on a website - in this example, the trace will represent calls made between the downstream services that handled the chain of requests initiated by this button being pressed.
What constitutes a single logical operation depends on the system. In the example above it is a single button press on a website, whereas in a batch processing system it might be for each item processed, or in a complex UI it might consist of both a button press and a subsequent confirmation dialog.
The W3C Trace Context Recommendation describes how the correlation information — an identifier for the operation, and the parent-child relationships between components — is passed in service calls, but doesn't cover what to do with that information, apart from how to pass it to the next component.
This is a guide mostly how to use Trace Context for logging, although it also applies to metrics and other telemetry.
What is a parent-id?
This is just the ID of the parent. But in a distributed trace there might be multiple components, A, B, C, D, where several of them are parents, so which parent is it the ID of, and which ID are we talking about?
In the context of a traceparent header, is it the ID of the parent of the receiver of the call — in other words, the ID of the sender.
The W3C Recommendation vaguely equates it to span-id (with a reference to requests, but not explaining what a span is), says that all zeros is invalid, and specifies to update it when sending an outgoing request (with a reference to the current operation).
However this is not really the complete story, or illustrate well how to use it.
Component parts of a distributed trace
A distributed trace occurs across multiple components, with each component doing a bit of processing, and a chain (or more accurately a tree) of requests linking the different bits of processing.
The W3C Recommendation is not very clear on what to call those bits of processing, at various points calling them events, requests, operations, or spans -- because the Recommendation is focused on passing the context, not on the processing.
But to understand the Recommendation, you need to know how it relates to the bits of processing.
For consistency we can refer to those bits of processing as spans.
Using this naming, the relevant identifiers are, in order of importance:
| Field | Description and purpose |
|---|---|
| trace‑id | Single consistent ID logical operation. Used to correlate all actions in the overall distributed trace. |
| span‑id | ID of the current span. Used to correlate all actions in the one bit of processing out of the overall logical operation, e.g. one request on one component. Inserted into outgoing requests in the traceparent header as the parent-id field. |
| parent‑id | ID of the parent span, if any, that a request was received from. Used to analyse the parent-child relationships between spans within the distributed trace. Taken from the incoming traceparent header. |
A span is a section of processing within an overall distributed trace, often corresponding to one request to a component (but not always). The parent-id is just the ID of the parent span. There is a good overview of spans, compatible with Trace Context, in the Open Telemetry specification.
How to really participate in a trace
The Recommendation only describes how to pass the context along to outgoing requests, but not what to actually do with the values.
If you did nothing except what was in the Recommendation you wouldn't really be participating, you would actually be obscuring information by replacing the parent-id.
To really participate in a distributed trace, when a component receives an incoming request with a traceparent header, it should start a new and record the details:
- Generate a new ID for the processing it will do (the span) and then, so we can correlate this span with the other spans, and record the link with the trace-id (from the header), the new span-id, and the ID of the parent span (from the parent-id field in the incoming header).
- Each log message should include at least the trace-id and the current span-id.
- For any outgoing requests, it should add a
traceparentheader with the trace-id, and put the current span-id into the parent-id field, so that the next component can record this span as the parent.
When a component initiates a distributed trace (e.g. a user presses a button), it should:
- Generate a trace-id for the logical operation, and record a new span-id for the first span (the initial processing) of the distributed trace.
- Include the trace-id and span-id in all log messages, and pass the trace-id and current span-id (in the parent-id field), in a
traceparentheader in outgoing requests.
A separate record is can be used for the link between the a span and it's parent span, and the logs within a single span, however this requires two different types of messages, to keep track of the relationships.
For simplicity, it may be easiest to simply record all three values — trace-id, span-id, and parent-id — with each log message, and ensure that components log at least one message, e.g. when the request is received. This does mean redundant information is repeated (the parent-id is repeated each log message), but also means you don't need to hunt down the special linking records.
On the initiating component, for the first span, there is no parent, so parent-id can be recorded as either null, or you can record a value of all zeros to represent this. (A value of all zeros will never be received as an actual parent-id).
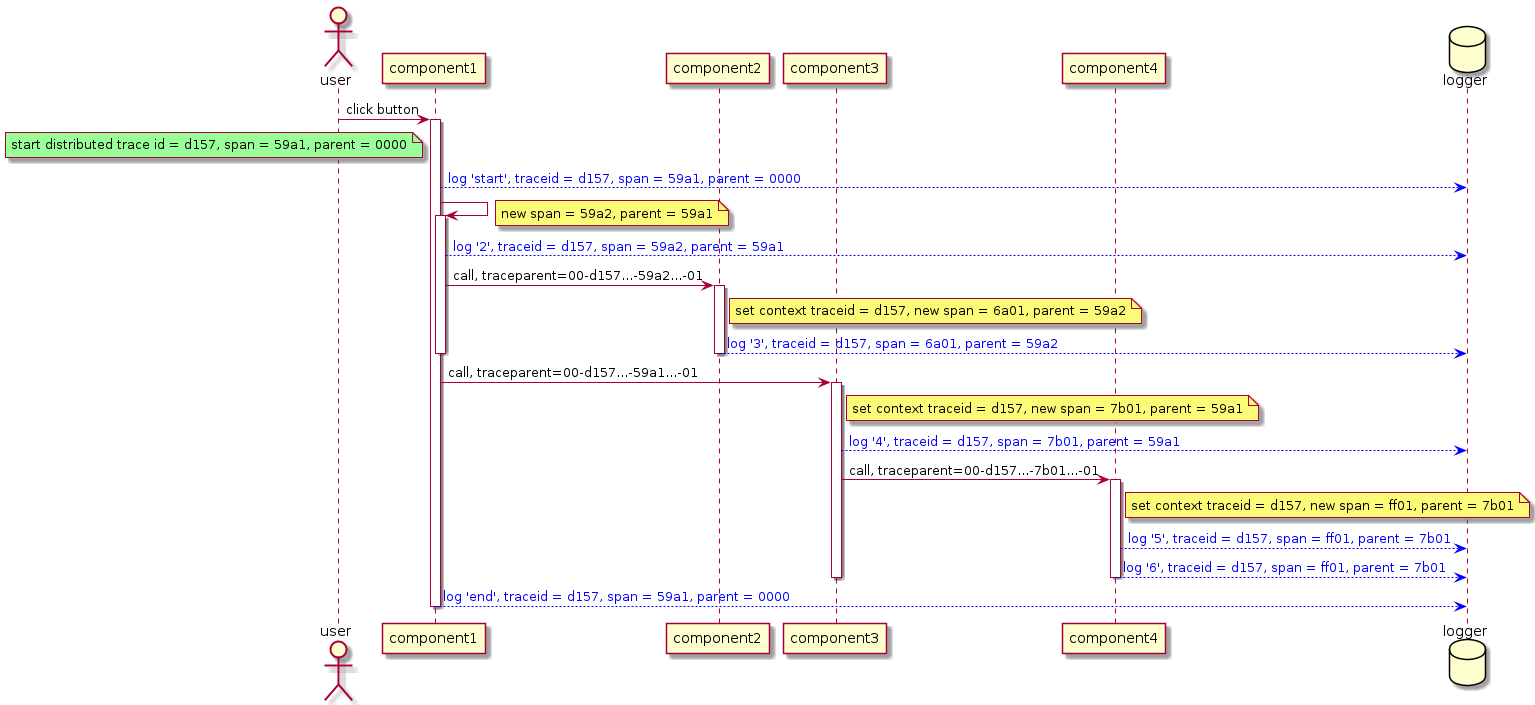
Log messages
The logged messages, from the above example, can be used to recreate all the activity that happened as part of the distributed trace, and the parent-id and span-id information can be used to recreate the parent-child hierarchy of spans.
| Log message | trace-id | span-id | parent-id |
|---|---|---|---|
| start | d157... | 59a1... | 0000... |
| 2 | d157... | 59a2... | 59a1... |
| 3 | d157... | 6a01... | 59a2... |
| 4 | d157... | 7b01... | 59a1... |
| 5 | d157... | ff01... | 7b01... |
| 6 | d157... | ff01... | 7b01... |
| end | d157... | 59a1... | 0000... |
One benefit of the W3C format is that even if log messages are missing, e.g. log 4 was missing from the above, then the remaining parts can still be correlated, even if the full parent-child tree can't be reconstructed.
| Log message | trace-id | span-id | parent-id |
|---|---|---|---|
| start | d157... | 59a1... | 0000... |
| 2 | d157... | 59a2... | 59a1... |
| 3 | d157... | 6a01... | 59a2... |
| 5 | d157... | ff01... | 7b01... |
| 6 | d157... | ff01... | 7b01... |
| end | d157... | 59a1... | 0000... |
In the above, we know all the parts are from the same distributed trace, starting with span 59a1..., know a partial tree from the root, and know that 5 and 6 are from the same span (on a particular component), but don't know which part of the first half is the parent of 7b01...
Microsoft ASP.NET implementation
Microsoft ASP.NET has already implemented W3C Trace Context, following the process above, as part of the standard libraries.
When an incoming requested is received with a traceparent header, ASP.NET automatically creates a new SpanId, and records the TraceId and ParentId from the incoming header.
The values are recorded in the Activity context class, and a Scope is created in Microsoft.Extensions.Logging, with the SpanId, TraceId, and ParentId values.
This means that all ILogger messages will include these three values and can be reported in a semantic logging application such as Elasticsearch or Seq, or included in other formats with Scopes enabled.
The Activity context class is then used to populate any outgoing web requests with an appropriate traceparent header containing the TraceId, and the SpanId of the current span (in the parent-id field).
You can also use the Activity class to initiate new logical operations (a new TraceId), or to create an in-process child span, and propagate the correct parent details.
Make sure to set the default format in Program.cs, so that newly created traces used the W3C format.
Activity.DefaultIdFormat = ActivityIdFormat.W3C;
Aside: History of alternative formats
There have been several alternative formats to correlated distributed traces in the past, although none of them have been standardised.
The simplest is just a single correlation ID that is passed along and shared, and recorded, by all components in the distributed trace. Although this correlates all the parts, it doesn't show the relationship between those parts.
Another approach that has been used is to record parent/child identifiers. For example earlier versions of .NET used Trace.CorrelationManager to record an ActivityId with all log messages, and had a way to record TraceTransfer messages from parent to child activities.
This was great for showing the relationship between parts, but required special processing to show those relationships, i.e. you can't query on a single value. It also broke if there was any gaps in the parent-child records.'
More recent versions of .NET used a variable length ID of the whole tree of requests, for example if A called B and then C, the correlation identifier would be something like "|a12345.b67.c89" Everything starting with "|a12345." was part of the same operation, and everything that started with "|a12345.b67." was a child of B.
This combines both the correlation value of a single identifier (the "|a12345." prefix), and could potentially get unwieldy the longer it got.
The W3C Trace Context format combines these approachs to have both a correlation part (the trace-id) and parent-child identifiers (the span-id, and the parent-id), with the benefit of being fixed length.
Azure Application Insights implementation
App Insights is in the process (as at November 2020) of changing over from variable length identifiers to W3C Trace Correlation headers.
This is a big enough topic that I have moved discussion to a separate post on App Insights trace correlation.
OpenTelemetry implementation
OpenTelemetry, which is a combination of several previous telemetry frameworks, uses W3C Trace Correlation for web propagation, and uses a similar structure for traces and spans.
It provides a good overview of what a trace is, what a span is, and has a link to a good description of distributed processing
https://opentelemetry.io/docs/concepts/data-sources/
Currently (November 2020) the libraries are in active development, with some only in early stages, e.g. the web libraries are only alpha versions. There is a collector / exporter for AppInsights, as well as many other platforms, and the project is supported by Microsoft.
If the project succeeds, then it will become a good basis for standardised logging across multiple languages and multiple telemetry products.
Mentions